![]()
NHL Data Visualization#
Project: Recreating the Masters#
Dr. N. C. Jacob#
24 April 2022#
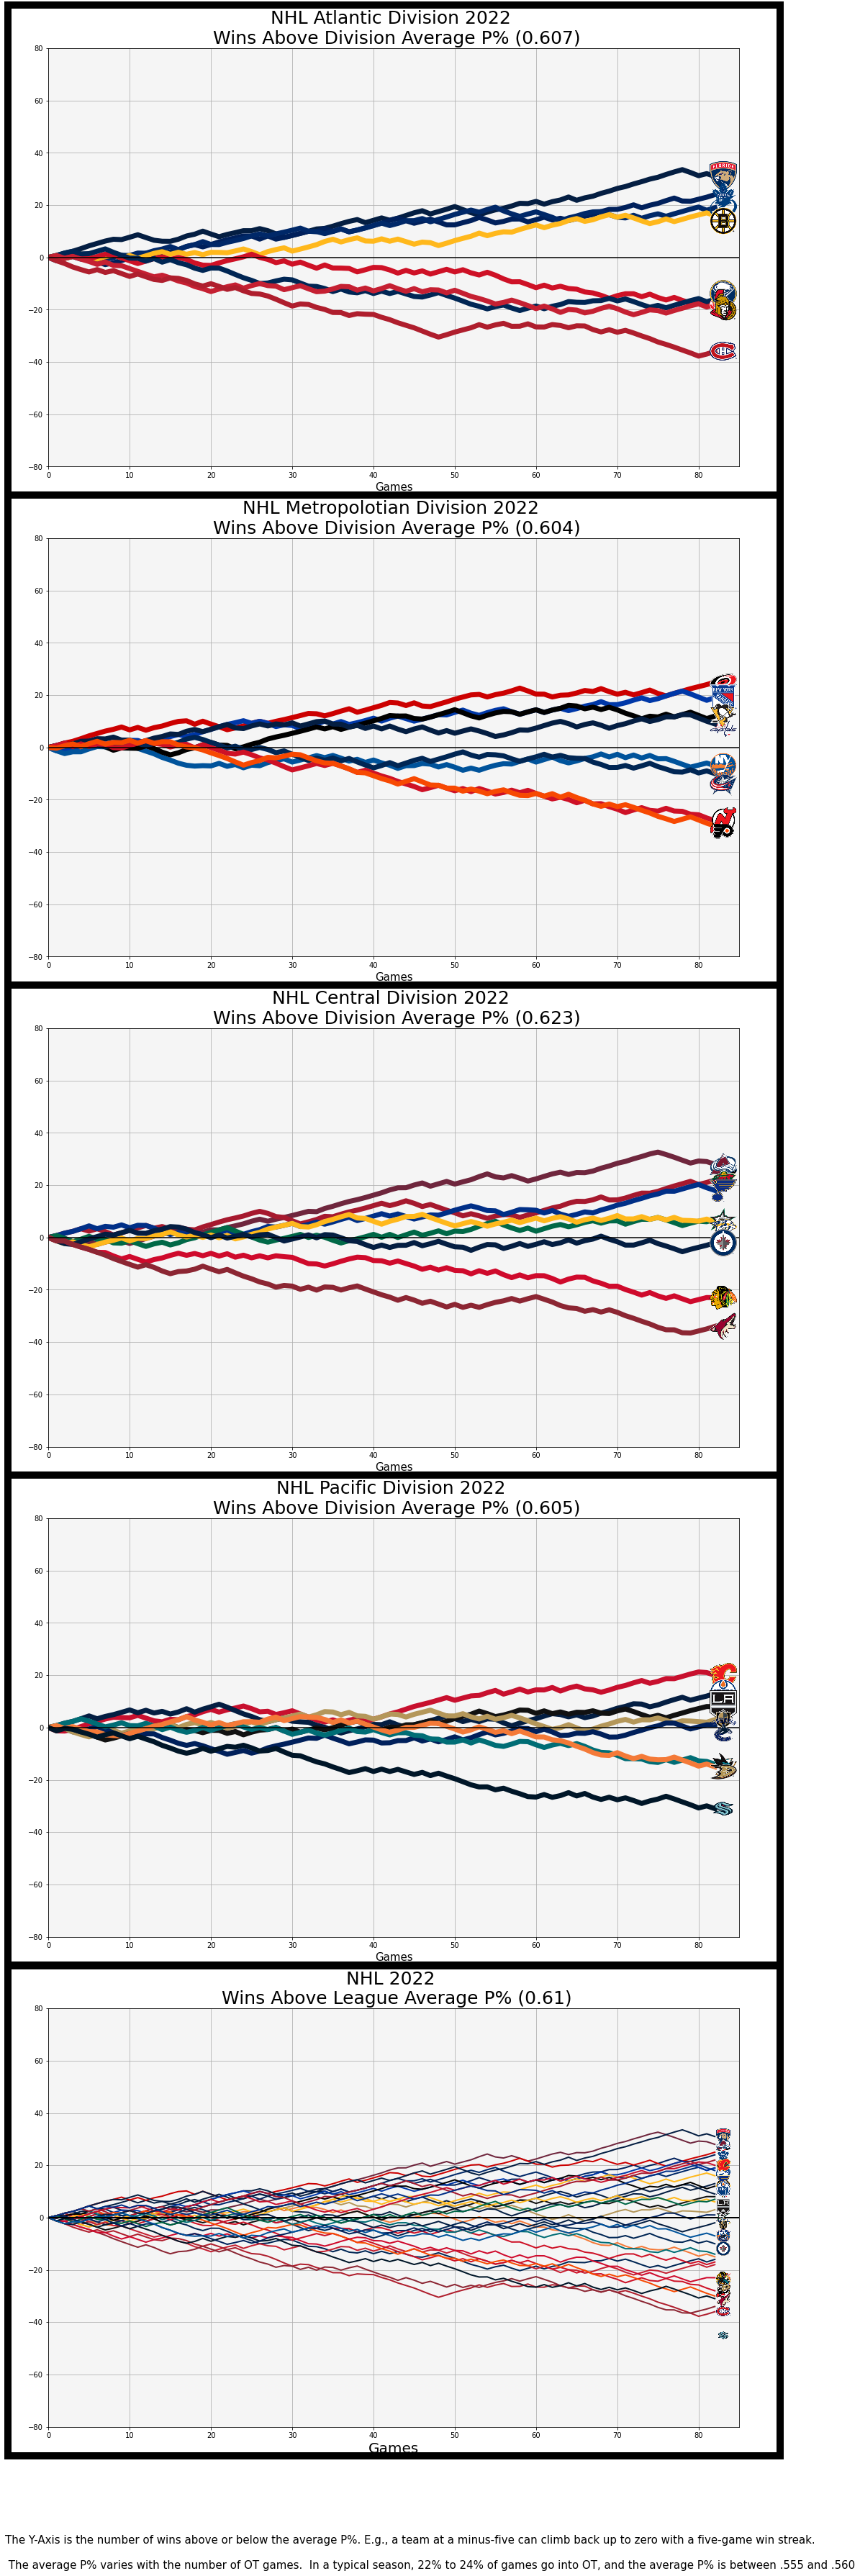
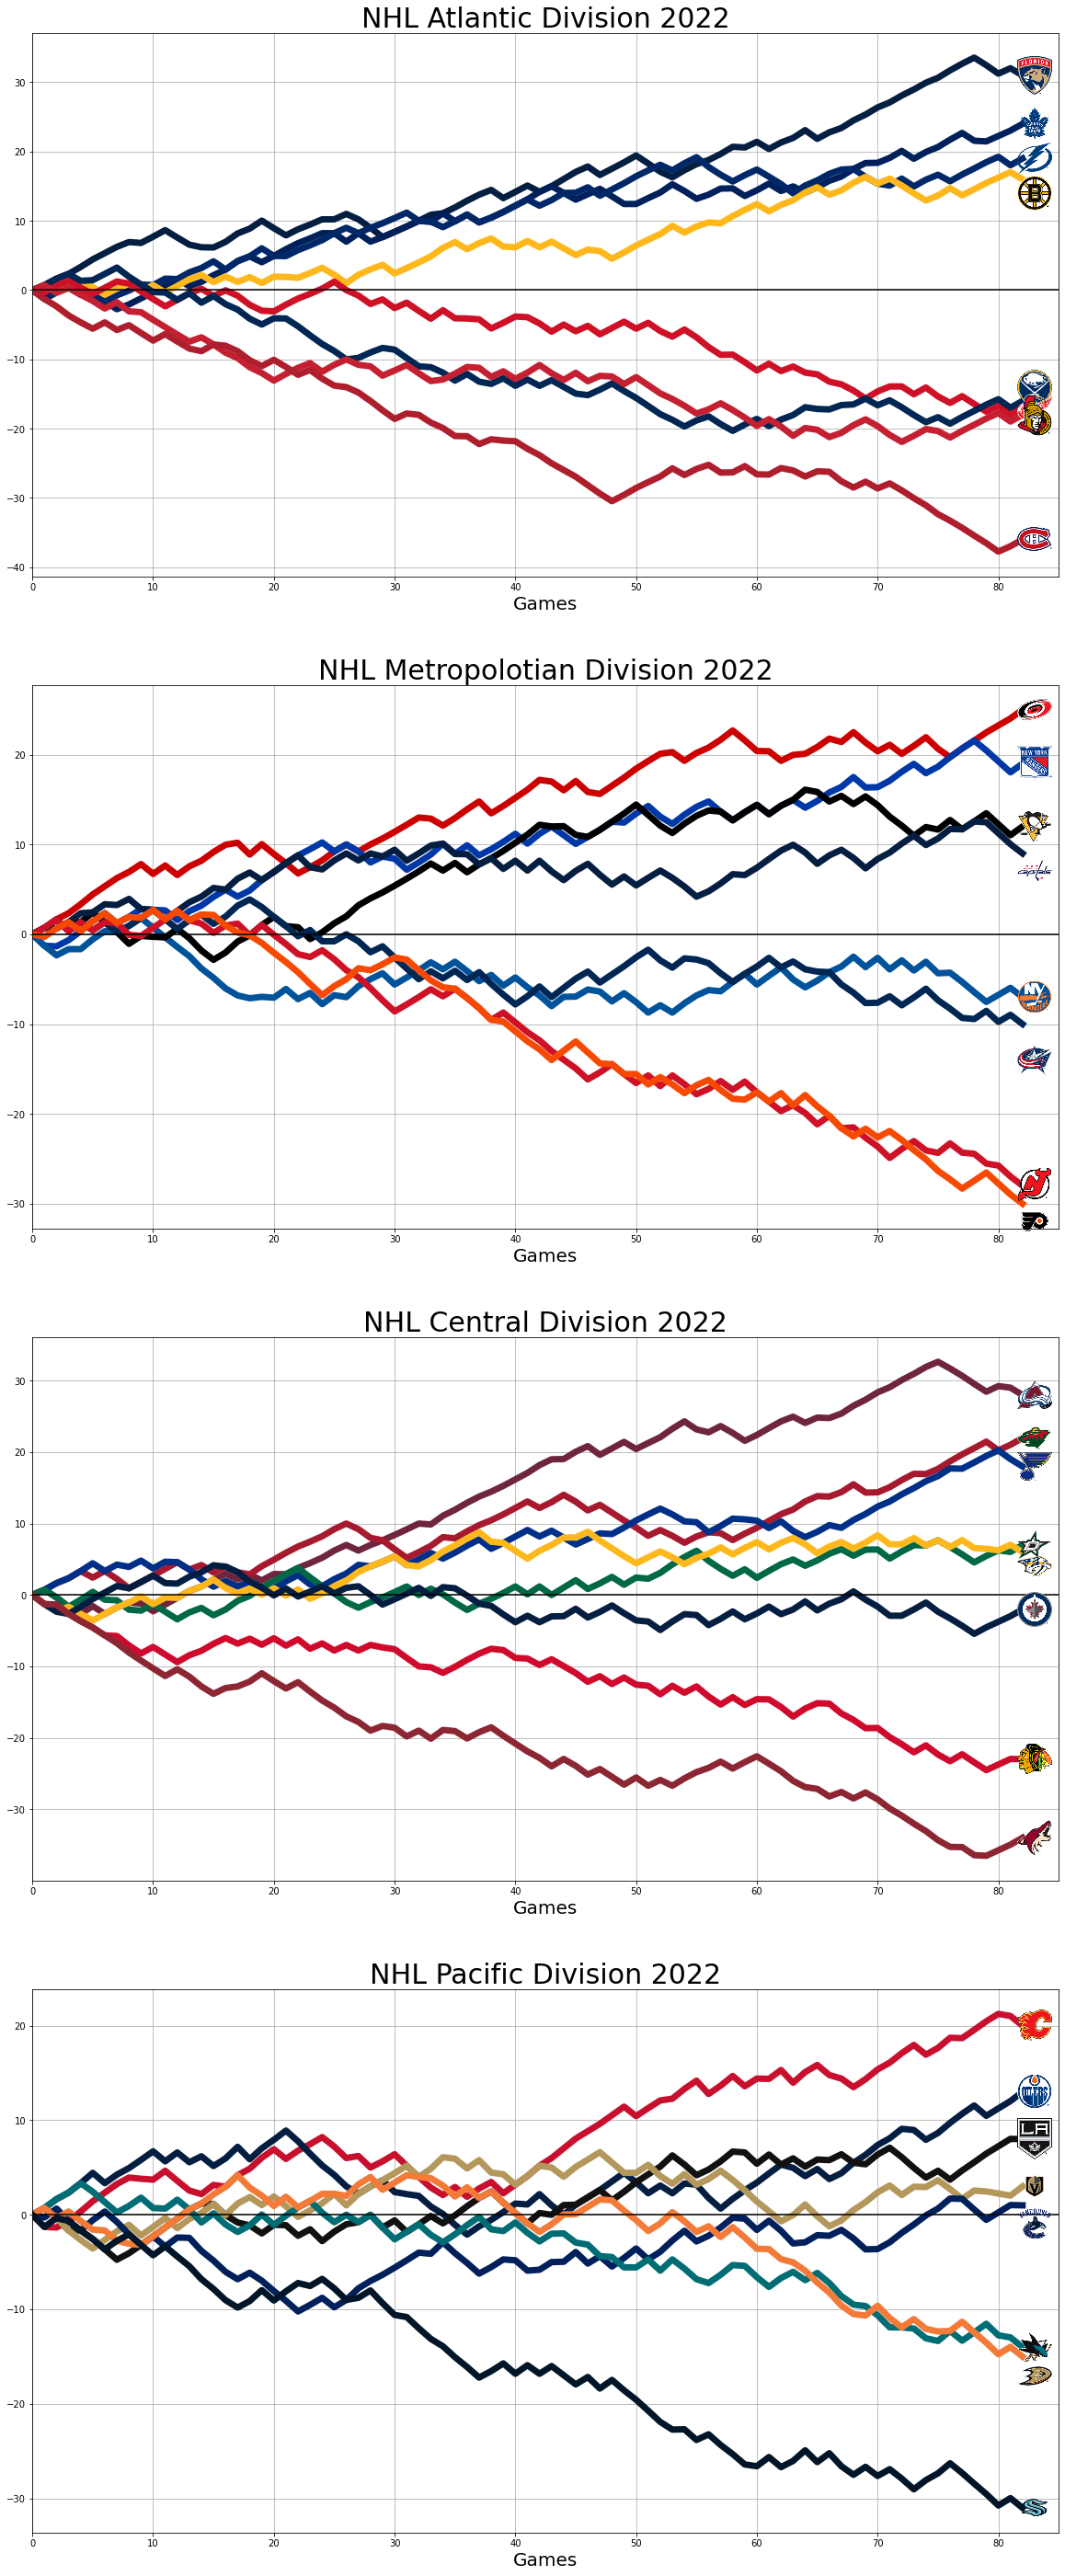
Hockey is my favorite spectator sport. I watch hockey most evenings before bed. With the Stanley Cup championship approaching, I wanted to see how my club was fairing (and brag a bit). I found a visualization from the previous season that I felt was worthy of recerating and attempt to do so in this document.
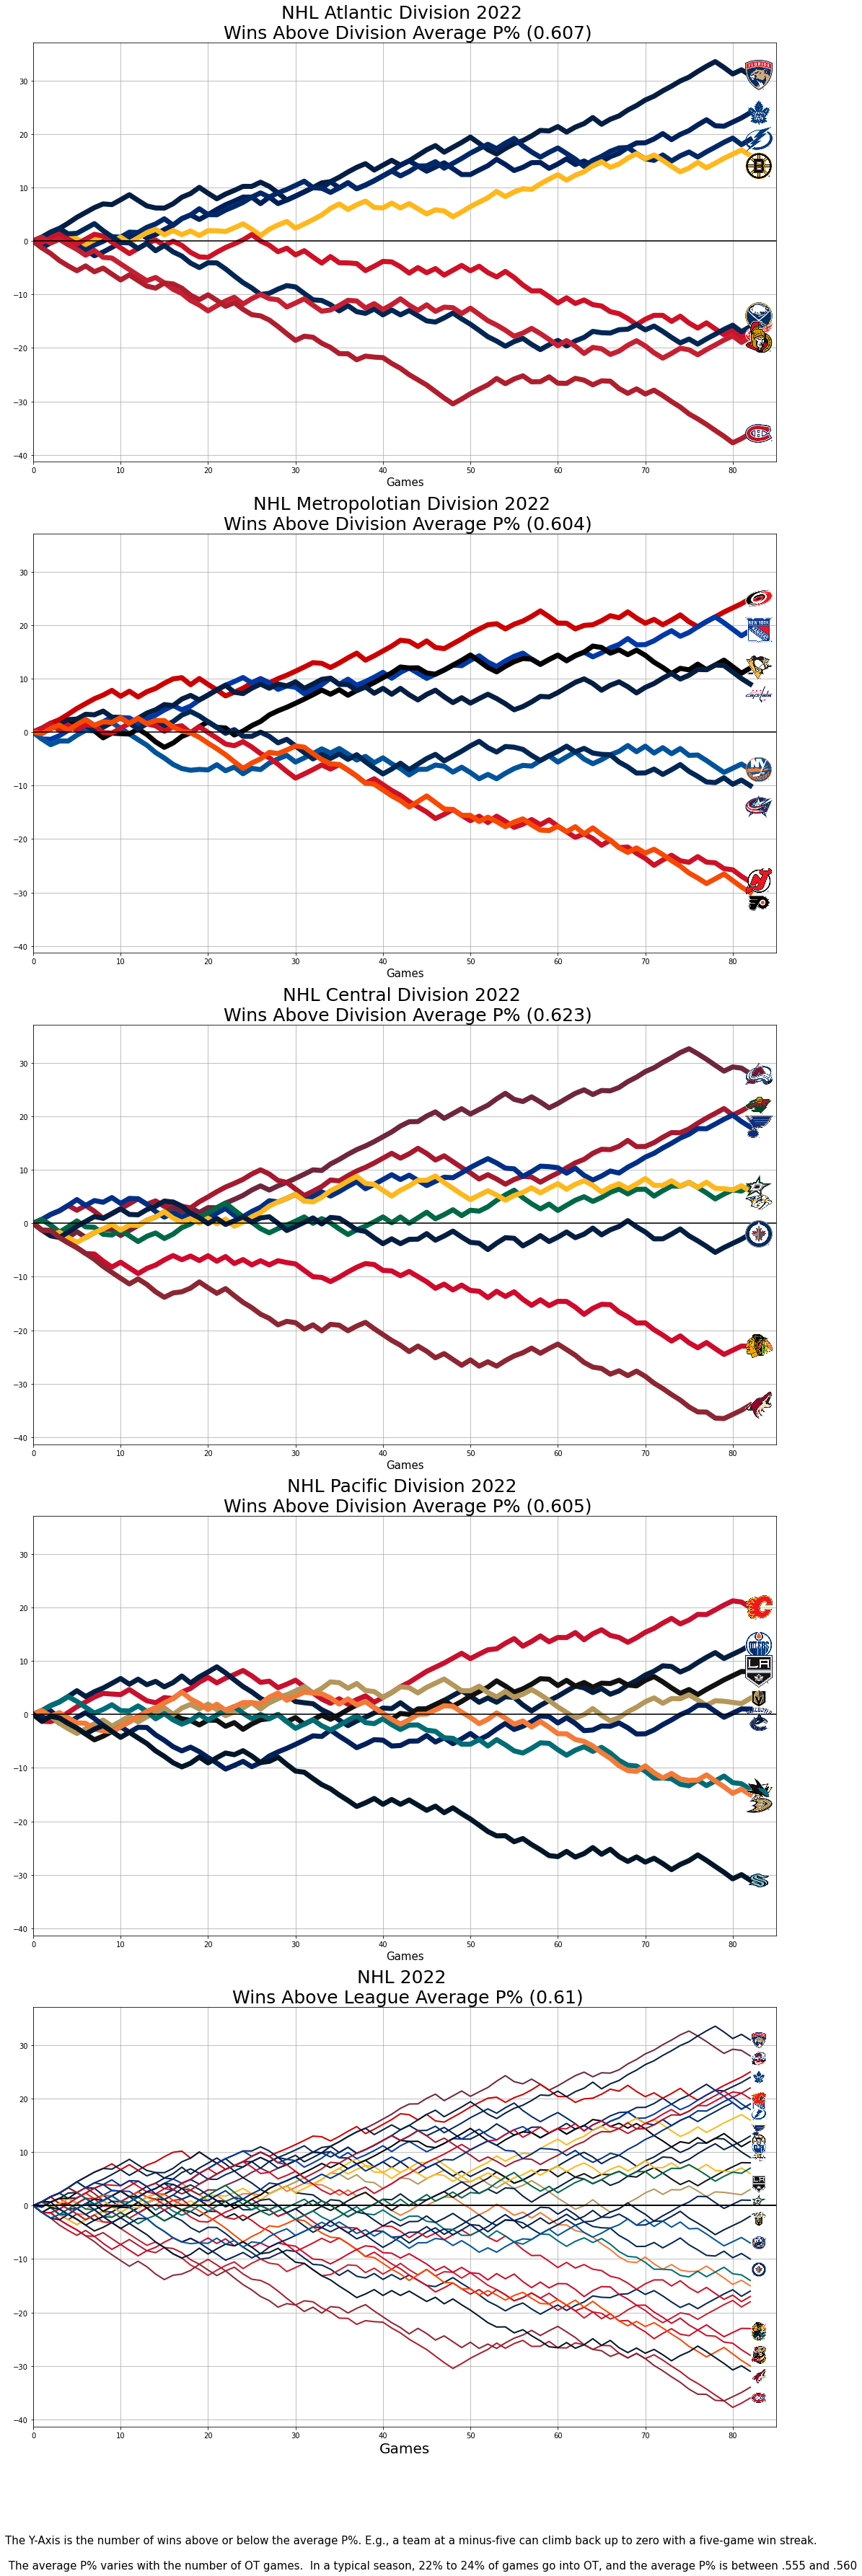
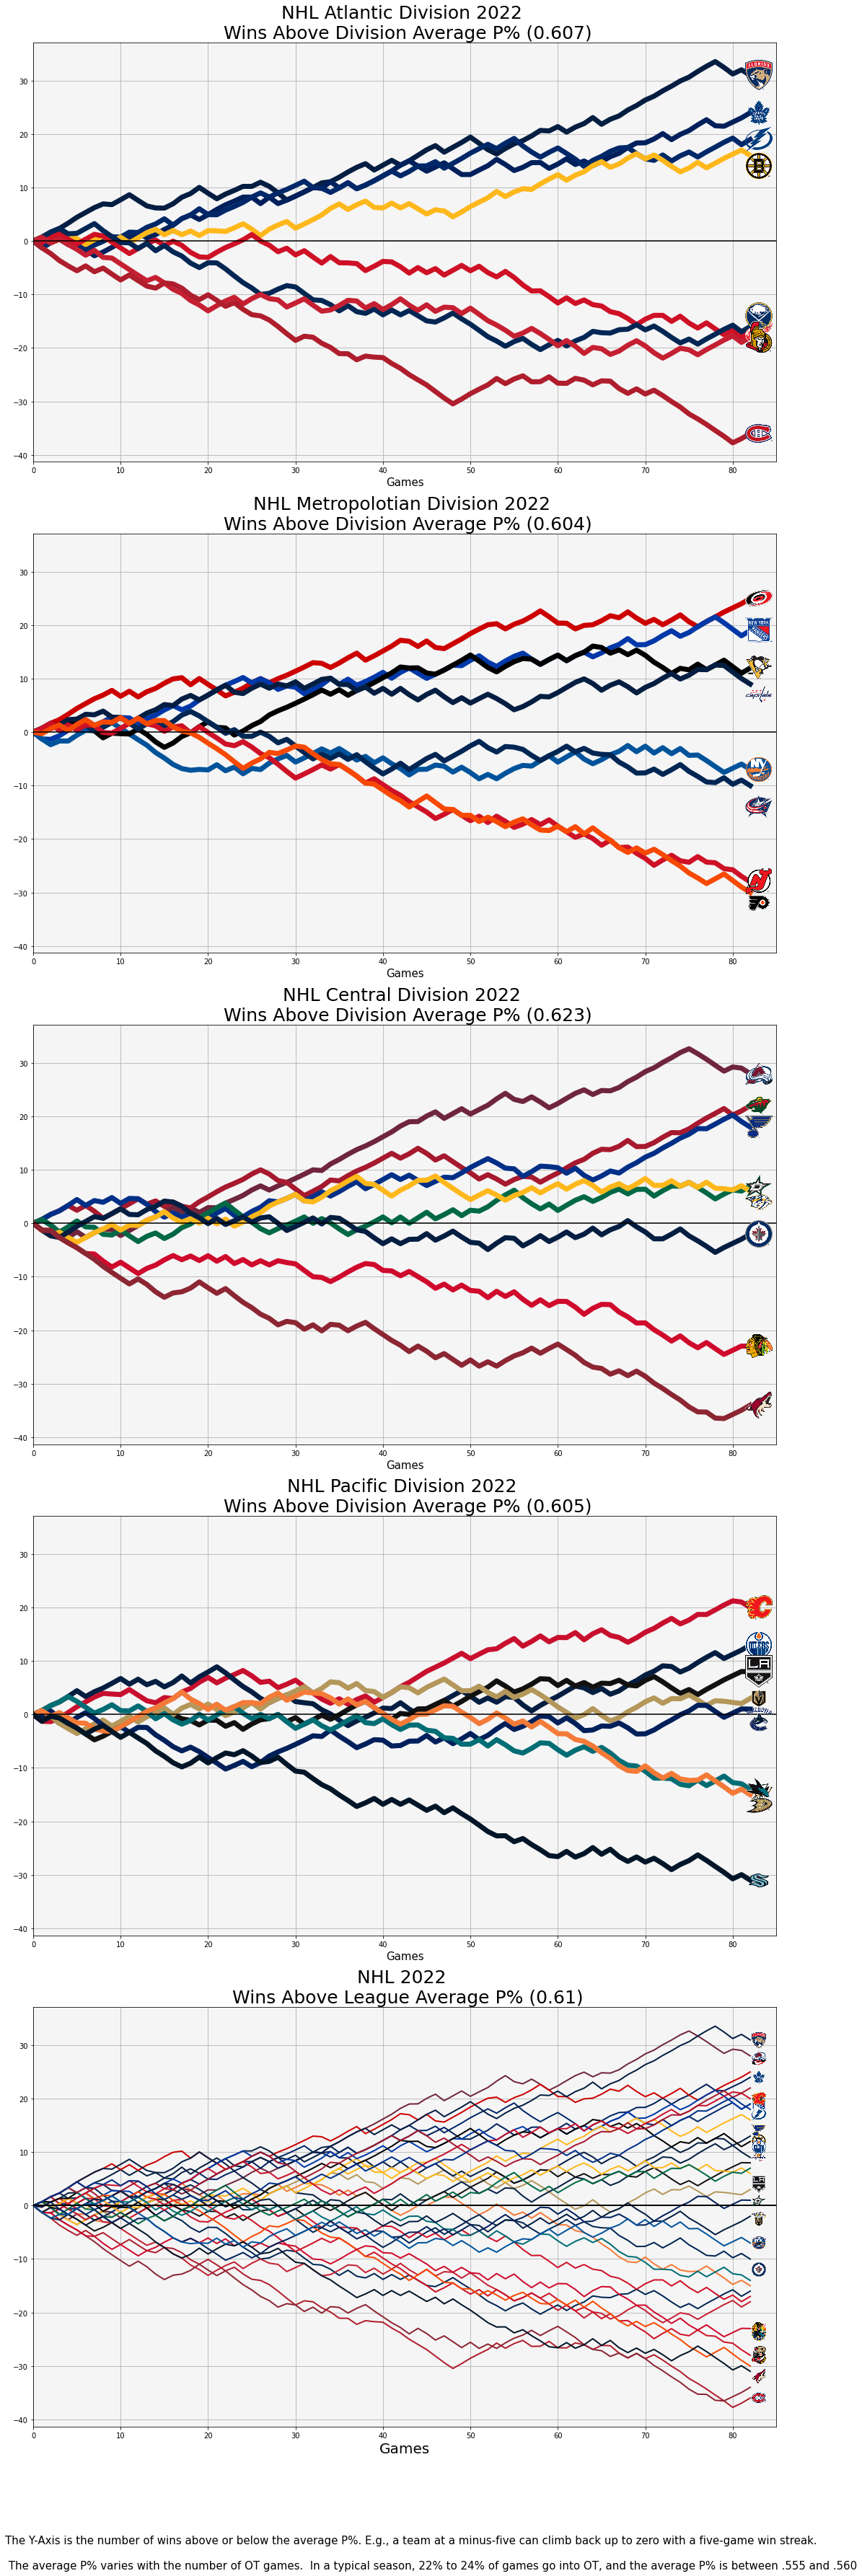
NHL uses a point system to determine the winners of the regular season. The victor of a match is awarded two points. If the regular time ends in a tie or draw, both teams are awarded a point and then vie in overtime for a third point. This causes some games to be worth a total of three points while other are only worth two. A team will need to average more than one point in each game to have a winning season. Teams represented above the \(x\)-axis here have scored more than one point each game while those falling below are not having a very good season. We can also see in each division which team will make the cut for the playoffs.
Graphical Excellence#
The above grahpic displays many aspects of grahpical excellence:
We see that there are five graphics all of which have had the data adjusted for the group it represents. This is much like using the time value of money, where you count for inflation. This is excellent because it displays in time the actual expected points which may vary as the season progresses.
The time series line has been drawn in a color representing each team.
The grahpic does not require a legend since each team has been represented by their logo.
Each division is highlighted as well as the entire league, showing us which teams are likely to make the playoffs in each.
Packages For Project#
import requests
import pandas as pa
from bs4 import BeautifulSoup
import numpy as np
import matplotlib.image as mpimg
import matplotlib.pyplot as plt
Data Gathering#
To be able to do this I am going to need sports data. I think I can find that at pro-hockey reference and images for the teams
The data for this was not readily available so I am going to have to do some work. I can gather each games data here and then I’ll go back and compute the point totals for each team after each game they play. Let’s see if we can get that to work!
r = requests.get('https://www.hockey-reference.com/leagues/NHL_2022_games.html')
html_contents = r.text
html_soup = BeautifulSoup(html_contents,"lxml")


len(html_soup.find_all('table'))
2
tables = html_soup.find_all('table')

df = pa.read_html(str(tables))[0]
df.head(10)
| Date | Visitor | G | Home | G.1 | Unnamed: 5 | Att. | LOG | Notes | |
|---|---|---|---|---|---|---|---|---|---|
| 0 | 2021-10-12 | Pittsburgh Penguins | 6 | Tampa Bay Lightning | 2 | NaN | 19092.0 | 2:33 | NaN |
| 1 | 2021-10-12 | Seattle Kraken | 3 | Vegas Golden Knights | 4 | NaN | 18431.0 | 2:25 | NaN |
| 2 | 2021-10-13 | Winnipeg Jets | 1 | Anaheim Ducks | 4 | NaN | 16260.0 | 2:29 | NaN |
| 3 | 2021-10-13 | Chicago Blackhawks | 2 | Colorado Avalanche | 4 | NaN | 18037.0 | 2:32 | NaN |
| 4 | 2021-10-13 | Vancouver Canucks | 2 | Edmonton Oilers | 3 | SO | 16034.0 | 2:42 | NaN |
| 5 | 2021-10-13 | Montreal Canadiens | 1 | Toronto Maple Leafs | 2 | NaN | 18493.0 | 2:33 | NaN |
| 6 | 2021-10-13 | New York Rangers | 1 | Washington Capitals | 5 | NaN | 18573.0 | 2:29 | NaN |
| 7 | 2021-10-14 | Montreal Canadiens | 1 | Buffalo Sabres | 5 | NaN | 8467.0 | 2:26 | NaN |
| 8 | 2021-10-14 | New York Islanders | 3 | Carolina Hurricanes | 6 | NaN | 18680.0 | 2:46 | NaN |
| 9 | 2021-10-14 | Arizona Coyotes | 2 | Columbus Blue Jackets | 8 | NaN | 17813.0 | 2:30 | NaN |
Well that part worked as well as excepcted! Let’s get all the teams and start building our season by games. There are 82 games in the season (most have only played around 70 right now when I gathered this!)
teams = [x.replace(" ","").replace(".","").lower() for x in df.Home.unique()]

games = ['game{}'.format(x) for x in range(1,83)]
pointsbygame = pa.DataFrame(np.nan, index = games,columns = teams)
pointsbygame.head()
| tampabaylightning | vegasgoldenknights | anaheimducks | coloradoavalanche | edmontonoilers | torontomapleleafs | washingtoncapitals | buffalosabres | carolinahurricanes | columbusbluejackets | ... | arizonacoyotes | calgaryflames | chicagoblackhawks | minnesotawild | winnipegjets | dallasstars | seattlekraken | stlouisblues | vancouvercanucks | newyorkislanders | |
|---|---|---|---|---|---|---|---|---|---|---|---|---|---|---|---|---|---|---|---|---|---|
| game1 | NaN | NaN | NaN | NaN | NaN | NaN | NaN | NaN | NaN | NaN | ... | NaN | NaN | NaN | NaN | NaN | NaN | NaN | NaN | NaN | NaN |
| game2 | NaN | NaN | NaN | NaN | NaN | NaN | NaN | NaN | NaN | NaN | ... | NaN | NaN | NaN | NaN | NaN | NaN | NaN | NaN | NaN | NaN |
| game3 | NaN | NaN | NaN | NaN | NaN | NaN | NaN | NaN | NaN | NaN | ... | NaN | NaN | NaN | NaN | NaN | NaN | NaN | NaN | NaN | NaN |
| game4 | NaN | NaN | NaN | NaN | NaN | NaN | NaN | NaN | NaN | NaN | ... | NaN | NaN | NaN | NaN | NaN | NaN | NaN | NaN | NaN | NaN |
| game5 | NaN | NaN | NaN | NaN | NaN | NaN | NaN | NaN | NaN | NaN | ... | NaN | NaN | NaN | NaN | NaN | NaN | NaN | NaN | NaN | NaN |
5 rows × 32 columns
def findwinner(game):
  if game['G']>game['G.1']:
    print('Visitor {}'.format(game['Visitor']) + ' Won')
  else:
    print('Home {}'.format(game['Home']) + ' Won')
findwinner(df.loc[0])
Visitor Pittsburgh Penguins Won
I need to do a little better than that! I’ll need to add 2 points for that game for the winner and 0 points for the loser (1 if it went to OT).
for team in teams:
  globals()[team] = []
def cleanteamname(teamname): #returns the list about the team.
  return globals()[teamname.replace(" ","").replace(".","").lower()]
def winner(game):
  if (game["G"] > game["G.1"]) & (not(pa.isnull(game['G']))):
    cleanteamname(game.Visitor).append(2)
  elif not(pa.isnull(game['G'])):
    cleanteamname(game.Home).append(2)
  else:
    cleanteamname(game.Home).append(np.nan)
    cleanteamname(game.Visitor).append(np.nan)

def loser(game):
  if pa.isnull(game['Unnamed: 5']): #No overtime
    val = 0
  else:
    val = 1 #gives a point for OT/SO loss
  if (game['G'] > game['G.1']) & (not(pa.isnull(game['G']))): #home team lost
    cleanteamname(game.Home).append(val)
  elif not(pa.isnull(game['G'])):
    cleanteamname(game.Visitor).append(val)
df.loc[1300]
Date                  2022-04-29
Visitor       Colorado Avalanche
G                              1
Home              Minnesota Wild
G.1                            4
Unnamed: 5                   NaN
Att.                     19261.0
LOG                         2:29
Notes                        NaN
Name: 1300, dtype: object
winner(df.loc[1300])

vancouvercanucks
[]
loser(df.loc[1300])

edmontonoilers
[]
Now that I see those working, I’ll clear the values away by resetting all the teams to an empty set
for team in teams:
  globals()[team] = []
Now to run this code for every game
for i in df.index:
  winner(df.loc[i])
  loser(df.loc[i])
stlouisblues
[2,
 2,
 2,
 2,
 2,
 0,
 2,
 1,
 2,
 0,
 2,
 1,
 0,
 0,
 0,
 2,
 0,
 2,
 0,
 1,
 2,
 2,
 0,
 1,
 2,
 2,
 2,
 1,
 2,
 2,
 0,
 2,
 2,
 0,
 2,
 2,
 2,
 0,
 2,
 2,
 2,
 0,
 2,
 0,
 0,
 2,
 2,
 1,
 2,
 2,
 2,
 2,
 0,
 0,
 1,
 0,
 2,
 2,
 1,
 1,
 0,
 2,
 0,
 0,
 2,
 2,
 1,
 2,
 2,
 2,
 2,
 2,
 2,
 2,
 2,
 2,
 1,
 2,
 2,
 2,
 0,
 0]
I think this worked. Now to store it in the dataframe.
len(stlouisblues)
82
pointsbygame['anaheimducks'] = anaheimducks
for team in teams:
  pointsbygame[team] = globals()[team]

pointsbygame
| tampabaylightning | vegasgoldenknights | anaheimducks | coloradoavalanche | edmontonoilers | torontomapleleafs | washingtoncapitals | buffalosabres | carolinahurricanes | columbusbluejackets | ... | arizonacoyotes | calgaryflames | chicagoblackhawks | minnesotawild | winnipegjets | dallasstars | seattlekraken | stlouisblues | vancouvercanucks | newyorkislanders | |
|---|---|---|---|---|---|---|---|---|---|---|---|---|---|---|---|---|---|---|---|---|---|
| game1 | 0 | 2 | 2 | 2 | 2 | 2 | 2 | 2 | 2 | 2 | ... | 0 | 0 | 0 | 2 | 0 | 2 | 0 | 2 | 1 | 0 |
| game2 | 2 | 0 | 0 | 0 | 2 | 0 | 1 | 2 | 2 | 2 | ... | 1 | 1 | 1 | 2 | 0 | 0 | 2 | 2 | 2 | 0 |
| game3 | 2 | 0 | 2 | 0 | 2 | 2 | 2 | 2 | 2 | 0 | ... | 0 | 2 | 0 | 2 | 1 | 0 | 1 | 2 | 0 | 2 |
| game4 | 0 | 0 | 0 | 0 | 2 | 1 | 2 | 0 | 2 | 2 | ... | 0 | 2 | 0 | 2 | 2 | 2 | 0 | 2 | 0 | 1 |
| game5 | 1 | 0 | 0 | 2 | 2 | 0 | 1 | 1 | 2 | 0 | ... | 0 | 2 | 0 | 0 | 2 | 2 | 0 | 2 | 2 | 2 |
| ... | ... | ... | ... | ... | ... | ... | ... | ... | ... | ... | ... | ... | ... | ... | ... | ... | ... | ... | ... | ... | ... |
| game78 | 2 | 2 | 0 | 0 | 2 | 0 | 2 | 2 | 2 | 1 | ... | 0 | 2 | 0 | 2 | 0 | 0 | 0 | 2 | 0 | 0 |
| game79 | 2 | 1 | 0 | 0 | 0 | 1 | 1 | 2 | 2 | 2 | ... | 1 | 2 | 0 | 2 | 2 | 2 | 0 | 2 | 0 | 0 |
| game80 | 2 | 1 | 0 | 2 | 2 | 2 | 0 | 2 | 2 | 0 | ... | 2 | 2 | 2 | 0 | 2 | 2 | 0 | 2 | 2 | 2 |
| game81 | 0 | 1 | 2 | 1 | 2 | 2 | 0 | 0 | 2 | 2 | ... | 2 | 1 | 2 | 2 | 2 | 1 | 2 | 0 | 2 | 2 |
| game82 | 2 | 2 | 0 | 0 | 2 | 2 | 0 | 2 | 2 | 0 | ... | 2 | 0 | 1 | 2 | 2 | 2 | 0 | 0 | 1 | 0 |
82 rows × 32 columns
totalpointsbygame = pa.DataFrame(np.nan, index = range(0,83),columns = teams)

for team in teams:
  globals()[team + 'total'] = [0]

for team in teams:
  points = 0
  for game in globals()[team]:
    points = points + game
    globals()[team + 'total'].append(points)
stlouisbluestotal
[0,
 2,
 4,
 6,
 8,
 10,
 10,
 12,
 13,
 15,
 15,
 17,
 18,
 18,
 18,
 18,
 20,
 20,
 22,
 22,
 23,
 25,
 27,
 27,
 28,
 30,
 32,
 34,
 35,
 37,
 39,
 39,
 41,
 43,
 43,
 45,
 47,
 49,
 49,
 51,
 53,
 55,
 55,
 57,
 57,
 57,
 59,
 61,
 62,
 64,
 66,
 68,
 70,
 70,
 70,
 71,
 71,
 73,
 75,
 76,
 77,
 77,
 79,
 79,
 79,
 81,
 83,
 84,
 86,
 88,
 90,
 92,
 94,
 96,
 98,
 100,
 102,
 103,
 105,
 107,
 109,
 109,
 109]
for team in teams:
  totalpointsbygame[team] = globals()[team + 'total']
totalpointsbygame
| tampabaylightning | vegasgoldenknights | anaheimducks | coloradoavalanche | edmontonoilers | torontomapleleafs | washingtoncapitals | buffalosabres | carolinahurricanes | columbusbluejackets | ... | arizonacoyotes | calgaryflames | chicagoblackhawks | minnesotawild | winnipegjets | dallasstars | seattlekraken | stlouisblues | vancouvercanucks | newyorkislanders | |
|---|---|---|---|---|---|---|---|---|---|---|---|---|---|---|---|---|---|---|---|---|---|
| 0 | 0 | 0 | 0 | 0 | 0 | 0 | 0 | 0 | 0 | 0 | ... | 0 | 0 | 0 | 0 | 0 | 0 | 0 | 0 | 0 | 0 |
| 1 | 0 | 2 | 2 | 2 | 2 | 2 | 2 | 2 | 2 | 2 | ... | 0 | 0 | 0 | 2 | 0 | 2 | 0 | 2 | 1 | 0 |
| 2 | 2 | 2 | 2 | 2 | 4 | 2 | 3 | 4 | 4 | 4 | ... | 1 | 1 | 1 | 4 | 0 | 2 | 2 | 4 | 3 | 0 |
| 3 | 4 | 2 | 4 | 2 | 6 | 4 | 5 | 6 | 6 | 4 | ... | 1 | 3 | 1 | 6 | 1 | 2 | 3 | 6 | 3 | 2 |
| 4 | 4 | 2 | 4 | 2 | 8 | 5 | 7 | 6 | 8 | 6 | ... | 1 | 5 | 1 | 8 | 3 | 4 | 3 | 8 | 3 | 3 |
| ... | ... | ... | ... | ... | ... | ... | ... | ... | ... | ... | ... | ... | ... | ... | ... | ... | ... | ... | ... | ... | ... |
| 78 | 104 | 89 | 74 | 116 | 98 | 108 | 99 | 69 | 108 | 77 | ... | 50 | 106 | 63 | 107 | 81 | 91 | 58 | 105 | 87 | 80 |
| 79 | 106 | 90 | 74 | 116 | 98 | 109 | 100 | 71 | 110 | 79 | ... | 51 | 108 | 63 | 109 | 83 | 93 | 58 | 107 | 87 | 80 |
| 80 | 108 | 91 | 74 | 118 | 100 | 111 | 100 | 73 | 112 | 79 | ... | 53 | 110 | 65 | 109 | 85 | 95 | 58 | 109 | 89 | 82 |
| 81 | 108 | 92 | 76 | 119 | 102 | 113 | 100 | 73 | 114 | 81 | ... | 55 | 111 | 67 | 111 | 87 | 96 | 60 | 109 | 91 | 84 |
| 82 | 110 | 94 | 76 | 119 | 104 | 115 | 100 | 75 | 116 | 81 | ... | 57 | 111 | 68 | 113 | 89 | 98 | 60 | 109 | 92 | 84 |
83 rows × 32 columns
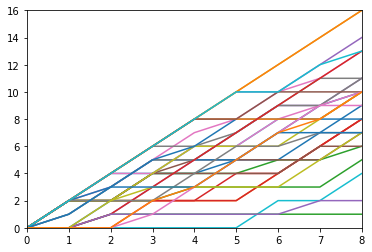
Ready for Visualizing#
totalpointsbygame.plot(kind = 'line', legend = False, xlim = [0,8], ylim = [0,16])
<matplotlib.axes._subplots.AxesSubplot at 0x7fc979e03e50>
Next I need to make the transformation to look at points above average. I’ll need the average of the league to do that.
np.mean(totalpointsbygame, axis = 1)
0      0.00000
1      1.28125
2      2.34375
3      3.65625
4      4.65625
        ...
78    86.43750
79    87.53125
80    88.75000
81    89.96875
82    91.00000
Length: 83, dtype: float64
Now I’ll convert the entries to be how much above or below this teams are at any point in the season.
def comparetoaverage(score,average):
  return score - average

totalpointsbygame.apply(lambda x: comparetoaverage(x,np.mean(totalpointsbygame, axis = 1)))
| tampabaylightning | vegasgoldenknights | anaheimducks | coloradoavalanche | edmontonoilers | torontomapleleafs | washingtoncapitals | buffalosabres | carolinahurricanes | columbusbluejackets | ... | arizonacoyotes | calgaryflames | chicagoblackhawks | minnesotawild | winnipegjets | dallasstars | seattlekraken | stlouisblues | vancouvercanucks | newyorkislanders | |
|---|---|---|---|---|---|---|---|---|---|---|---|---|---|---|---|---|---|---|---|---|---|
| 0 | 0.00000 | 0.00000 | 0.00000 | 0.00000 | 0.00000 | 0.00000 | 0.00000 | 0.00000 | 0.00000 | 0.00000 | ... | 0.00000 | 0.00000 | 0.00000 | 0.00000 | 0.00000 | 0.00000 | 0.00000 | 0.00000 | 0.00000 | 0.00000 |
| 1 | -1.28125 | 0.71875 | 0.71875 | 0.71875 | 0.71875 | 0.71875 | 0.71875 | 0.71875 | 0.71875 | 0.71875 | ... | -1.28125 | -1.28125 | -1.28125 | 0.71875 | -1.28125 | 0.71875 | -1.28125 | 0.71875 | -0.28125 | -1.28125 |
| 2 | -0.34375 | -0.34375 | -0.34375 | -0.34375 | 1.65625 | -0.34375 | 0.65625 | 1.65625 | 1.65625 | 1.65625 | ... | -1.34375 | -1.34375 | -1.34375 | 1.65625 | -2.34375 | -0.34375 | -0.34375 | 1.65625 | 0.65625 | -2.34375 |
| 3 | 0.34375 | -1.65625 | 0.34375 | -1.65625 | 2.34375 | 0.34375 | 1.34375 | 2.34375 | 2.34375 | 0.34375 | ... | -2.65625 | -0.65625 | -2.65625 | 2.34375 | -2.65625 | -1.65625 | -0.65625 | 2.34375 | -0.65625 | -1.65625 |
| 4 | -0.65625 | -2.65625 | -0.65625 | -2.65625 | 3.34375 | 0.34375 | 2.34375 | 1.34375 | 3.34375 | 1.34375 | ... | -3.65625 | 0.34375 | -3.65625 | 3.34375 | -1.65625 | -0.65625 | -1.65625 | 3.34375 | -1.65625 | -1.65625 |
| ... | ... | ... | ... | ... | ... | ... | ... | ... | ... | ... | ... | ... | ... | ... | ... | ... | ... | ... | ... | ... | ... |
| 78 | 17.56250 | 2.56250 | -12.43750 | 29.56250 | 11.56250 | 21.56250 | 12.56250 | -17.43750 | 21.56250 | -9.43750 | ... | -36.43750 | 19.56250 | -23.43750 | 20.56250 | -5.43750 | 4.56250 | -28.43750 | 18.56250 | 0.56250 | -6.43750 |
| 79 | 18.46875 | 2.46875 | -13.53125 | 28.46875 | 10.46875 | 21.46875 | 12.46875 | -16.53125 | 22.46875 | -8.53125 | ... | -36.53125 | 20.46875 | -24.53125 | 21.46875 | -4.53125 | 5.46875 | -29.53125 | 19.46875 | -0.53125 | -7.53125 |
| 80 | 19.25000 | 2.25000 | -14.75000 | 29.25000 | 11.25000 | 22.25000 | 11.25000 | -15.75000 | 23.25000 | -9.75000 | ... | -35.75000 | 21.25000 | -23.75000 | 20.25000 | -3.75000 | 6.25000 | -30.75000 | 20.25000 | 0.25000 | -6.75000 |
| 81 | 18.03125 | 2.03125 | -13.96875 | 29.03125 | 12.03125 | 23.03125 | 10.03125 | -16.96875 | 24.03125 | -8.96875 | ... | -34.96875 | 21.03125 | -22.96875 | 21.03125 | -2.96875 | 6.03125 | -29.96875 | 19.03125 | 1.03125 | -5.96875 |
| 82 | 19.00000 | 3.00000 | -15.00000 | 28.00000 | 13.00000 | 24.00000 | 9.00000 | -16.00000 | 25.00000 | -10.00000 | ... | -34.00000 | 20.00000 | -23.00000 | 22.00000 | -2.00000 | 7.00000 | -31.00000 | 18.00000 | 1.00000 | -7.00000 |
83 rows × 32 columns
totalpointsbygame.apply(lambda x: comparetoaverage(x,np.mean(totalpointsbygame, axis = 1))).plot(kind = 'line', legend = False, xlim = [0,8], ylim = [-8,8])
<matplotlib.axes._subplots.AxesSubplot at 0x7fc979ccddd0>
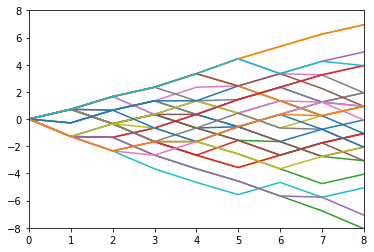
Let’s try to cut the graph off at 10 games but leave some room for team emblems.
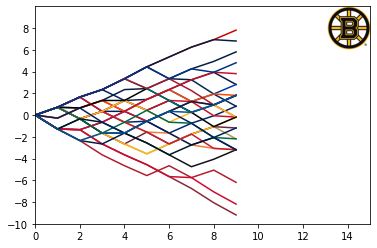
totalpointsbygame.apply(lambda x: comparetoaverage(x,np.mean(totalpointsbygame, axis = 1))).iloc[0:10,:].plot(kind = 'line', legend = False, xlim = [0,15], ylim = [-10,10], yticks = range(-10,10,2))
<matplotlib.axes._subplots.AxesSubplot at 0x7fc979846ad0>
Team Colors#
Next I am going to work on the colors so that they correspond to the team colors.
colors = {
    'anaheimducks':'#F47A38',
    'arizonacoyotes':'#8C2633'
}
totalpointsbygame.apply(lambda x: comparetoaverage(x,np.mean(totalpointsbygame, axis = 1))).loc[0:10,['anaheimducks','arizonacoyotes']].plot(kind = 'line', legend = False, xlim = [0,15], ylim = [-10,10], yticks = range(-10,10,2), color = colors)
<matplotlib.axes._subplots.AxesSubplot at 0x7fc979cbdd90>
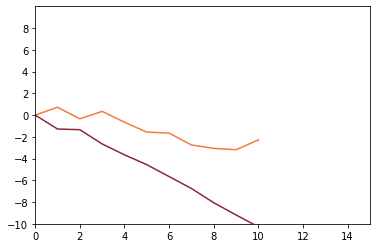
I think that is working. This is not the most exciting way to do this but the website I found requires lots of clicking…
colors['bostonbruins'] = '#FFB81C'
colors['buffalosabres'] = '#002654'
colors['calgaryflames'] = '#c8102E'
colors['carolinahurricanes'] = '#cc0000'
colors['chicagoblackhawks'] = '#CF0A2C'
colors['coloradoavalanche'] = '#6F263D'
colors['columbusbluejackets'] = '#002654'
colors['dallasstars'] = '#006847'
colors['detroitredwings'] = '#ce1126'
colors['edmontonoilers'] = '#041E42'
colors['floridapanthers'] = '#041E42'
colors['losangeleskings'] = '#111111'
colors['minnesotawild'] = '#A6192E'
colors['montrealcanadiens'] = '#AF1E2D'
colors['nashvillepredators'] = '#FFB81C'
colors['newjerseydevils'] = '#CE1126'
colors['newyorkislanders'] = '#00539b'
colors['newyorkrangers'] = '#0038A8'
colors['ottawasenators'] = '#c52032'
colors['pittsburghpenguins'] = '#000000'
colors['philadelphiaflyers'] = '#F74902'
colors['stlouisblues'] = '#002F87'
colors['sanjosesharks'] = '#006D75'
colors['seattlekraken'] = '#001628'
colors['tampabaylightning'] = '#002868'
colors['torontomapleleafs'] = '#00205b'
colors['vancouvercanucks'] = '#00205B'
colors['vegasgoldenknights'] = '#B4975A'
colors['washingtoncapitals'] = '#041E42'
colors['winnipegjets'] = '#041E42'
len(colors)
32
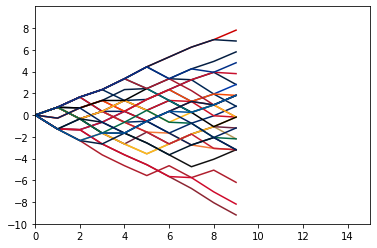
totalpointsbygame.apply(lambda x: comparetoaverage(x,np.mean(totalpointsbygame, axis = 1))).iloc[0:10,:].plot(kind = 'line', legend = False, xlim = [0,15], ylim = [-10,10], yticks = range(-10,10,2), color = colors)
<matplotlib.axes._subplots.AxesSubplot at 0x7fc97bda0750>
Divisions#
I am going to need the divisions for each club.
atlantic = [
            'floridapanthers',
            'torontomapleleafs',
            'tampabaylightning',
            'bostonbruins',
            'detroitredwings',
            'buffalosabres',
            'ottawasenators',
            'montrealcanadiens'
]

metropolotian = [
                 'carolinahurricanes',
                 'newyorkrangers',
                 'newyorkislanders',
                 'pittsburghpenguins',
                 'washingtoncapitals',
                 'columbusbluejackets',
                 'newjerseydevils',
                 'philadelphiaflyers'
]

central = [
           'coloradoavalanche',
           'minnesotawild',
           'stlouisblues',
           'dallasstars',
           'nashvillepredators',
           'winnipegjets',
           'chicagoblackhawks',
           'arizonacoyotes'
]

pacific = [
           'calgaryflames',
           'edmontonoilers',
           'losangeleskings',
           'vegasgoldenknights',
           'vancouvercanucks',
           'sanjosesharks',
           'anaheimducks',
           'seattlekraken'
]

division = [atlantic, metropolotian, central, pacific]
Divisions = ['Atlantic', 'Metropolotian', 'Central', 'Pacific']
Emblems#
linkstub = "https://raw.githubusercontent.com/nurfnick/Data_Viz/main/Content/Project_Examples/NHL_Logos/"
from matplotlib.offsetbox import TextArea, DrawingArea, OffsetImage, AnnotationBbox
fig, ax = plt.subplots()

ax.set_xlim(0, 1)
ax.set_ylim(0, 1)

arr_lena = plt.imread(linkstub +'bostonbruins.png')

#ax.imshow(arr_lena)
newax = fig.add_axes([0.8, 0.8, 0.2, 0.2], anchor='NE', zorder=1)
newax.imshow(arr_lena)
newax.axis('off')
#imagebox = OffsetImage(arr_lena, zoom=0.2)

#ab = AnnotationBbox(imagebox, (0.4, 0.6))

#ax.add_artist(ab)
plt.draw()
plt.show()
fig = totalpointsbygame.apply(lambda x: comparetoaverage(x,np.mean(totalpointsbygame, axis = 1))).iloc[0:10,:].plot(kind = 'line', legend = False, xlim = [0,15], ylim = [-10,10], yticks = range(-10,10,2), color = colors)


arr_lena = plt.imread(linkstub + 'bostonbruins.png')


axin = fig.inset_axes([0.8,0.8,0.2,0.2], anchor='NE', zorder=1)    # create new inset axes in data coordinates
axin.imshow(arr_lena)
axin.axis('off')


plt.show()
fig, ax = plt.subplots()

ax.set_xlim(0, 1)
ax.set_ylim(0, 1)

arr_lena = plt.imread(linkstub + 'bostonbruins.png')


imagebox = OffsetImage(arr_lena, zoom=0.2)

ab = AnnotationBbox(imagebox, (0.4, 0.6), frameon = False)

ax.add_artist(ab)
plt.draw()
plt.show()
fig = totalpointsbygame.apply(lambda x: comparetoaverage(x,np.mean(totalpointsbygame, axis = 1))).iloc[0:10,:].plot(kind = 'line', legend = False, xlim = [0,15], ylim = [-10,10], yticks = range(-10,10,2), color = colors)


arr_lena = plt.imread(linkstub + 'bostonbruins.png')


imagebox = OffsetImage(arr_lena, zoom=0.1)

ab = AnnotationBbox(imagebox, (9.5, 0), frameon = False)

fig.add_artist(ab)


plt.show()
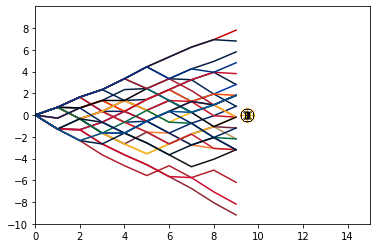
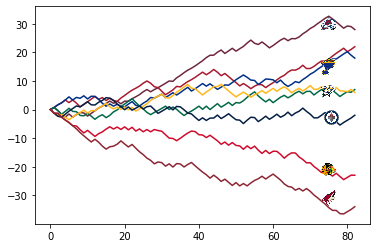
fig = totalpointsbygame.apply(lambda x: comparetoaverage(x,np.mean(totalpointsbygame, axis = 1))).loc[0:9,central].plot(kind = 'line', legend = False, xlim = [0,15], ylim = [-10,10], yticks = range(-10,10,2), color = colors)
dontoverlay = []
for team in central:
  y = totalpointsbygame.apply(lambda x: comparetoaverage(x,np.mean(totalpointsbygame, axis = 1))).loc[9,team]
  if y in dontoverlay:
    move = .6
  else:
    move = 0
  dontoverlay.append(y)
  arr_lena = plt.imread(linkstub + team + '.png') #needs to be team name +".png"
  imagebox = OffsetImage(arr_lena, zoom=0.1)
  ab = AnnotationBbox(imagebox, (9.5+move,totalpointsbygame.apply(lambda x: comparetoaverage(x,np.mean(totalpointsbygame, axis = 1))).loc[9,team] ), frameon = False)
  fig.add_artist(ab)

plt.show()
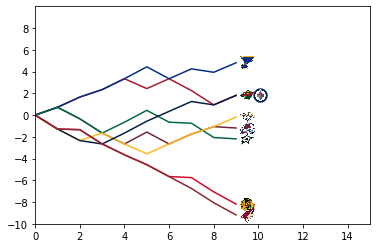
fig = totalpointsbygame.apply(lambda x: comparetoaverage(x,np.mean(totalpointsbygame, axis = 1))).loc[0:,central].plot(kind = 'line',
                                                                                                                        legend = False,
                                                                                                                        #xlim = [0,15],
                                                                                                                        #ylim = [-10,10],
                                                                                                                        #yticks = range(-10,10,2),
                                                                                                                        color = colors)
dontoverlay = []
for team in central:
  y = totalpointsbygame.apply(lambda x: comparetoaverage(x,np.mean(totalpointsbygame, axis = 1))).loc[9,team]
  if y in dontoverlay:
    move = .6
  else:
    move = 0
  dontoverlay.append(y)
  arr_lena = plt.imread(linkstub + team + '.png') #needs to be team name +".png"
  imagebox = OffsetImage(arr_lena, zoom=0.1)
  ab = AnnotationBbox(imagebox, (75+move,totalpointsbygame.apply(lambda x: comparetoaverage(x,np.mean(totalpointsbygame, axis = 1))).loc[72,team] ), frameon = False)
  fig.add_artist(ab)

plt.show()
Putting it all Together#
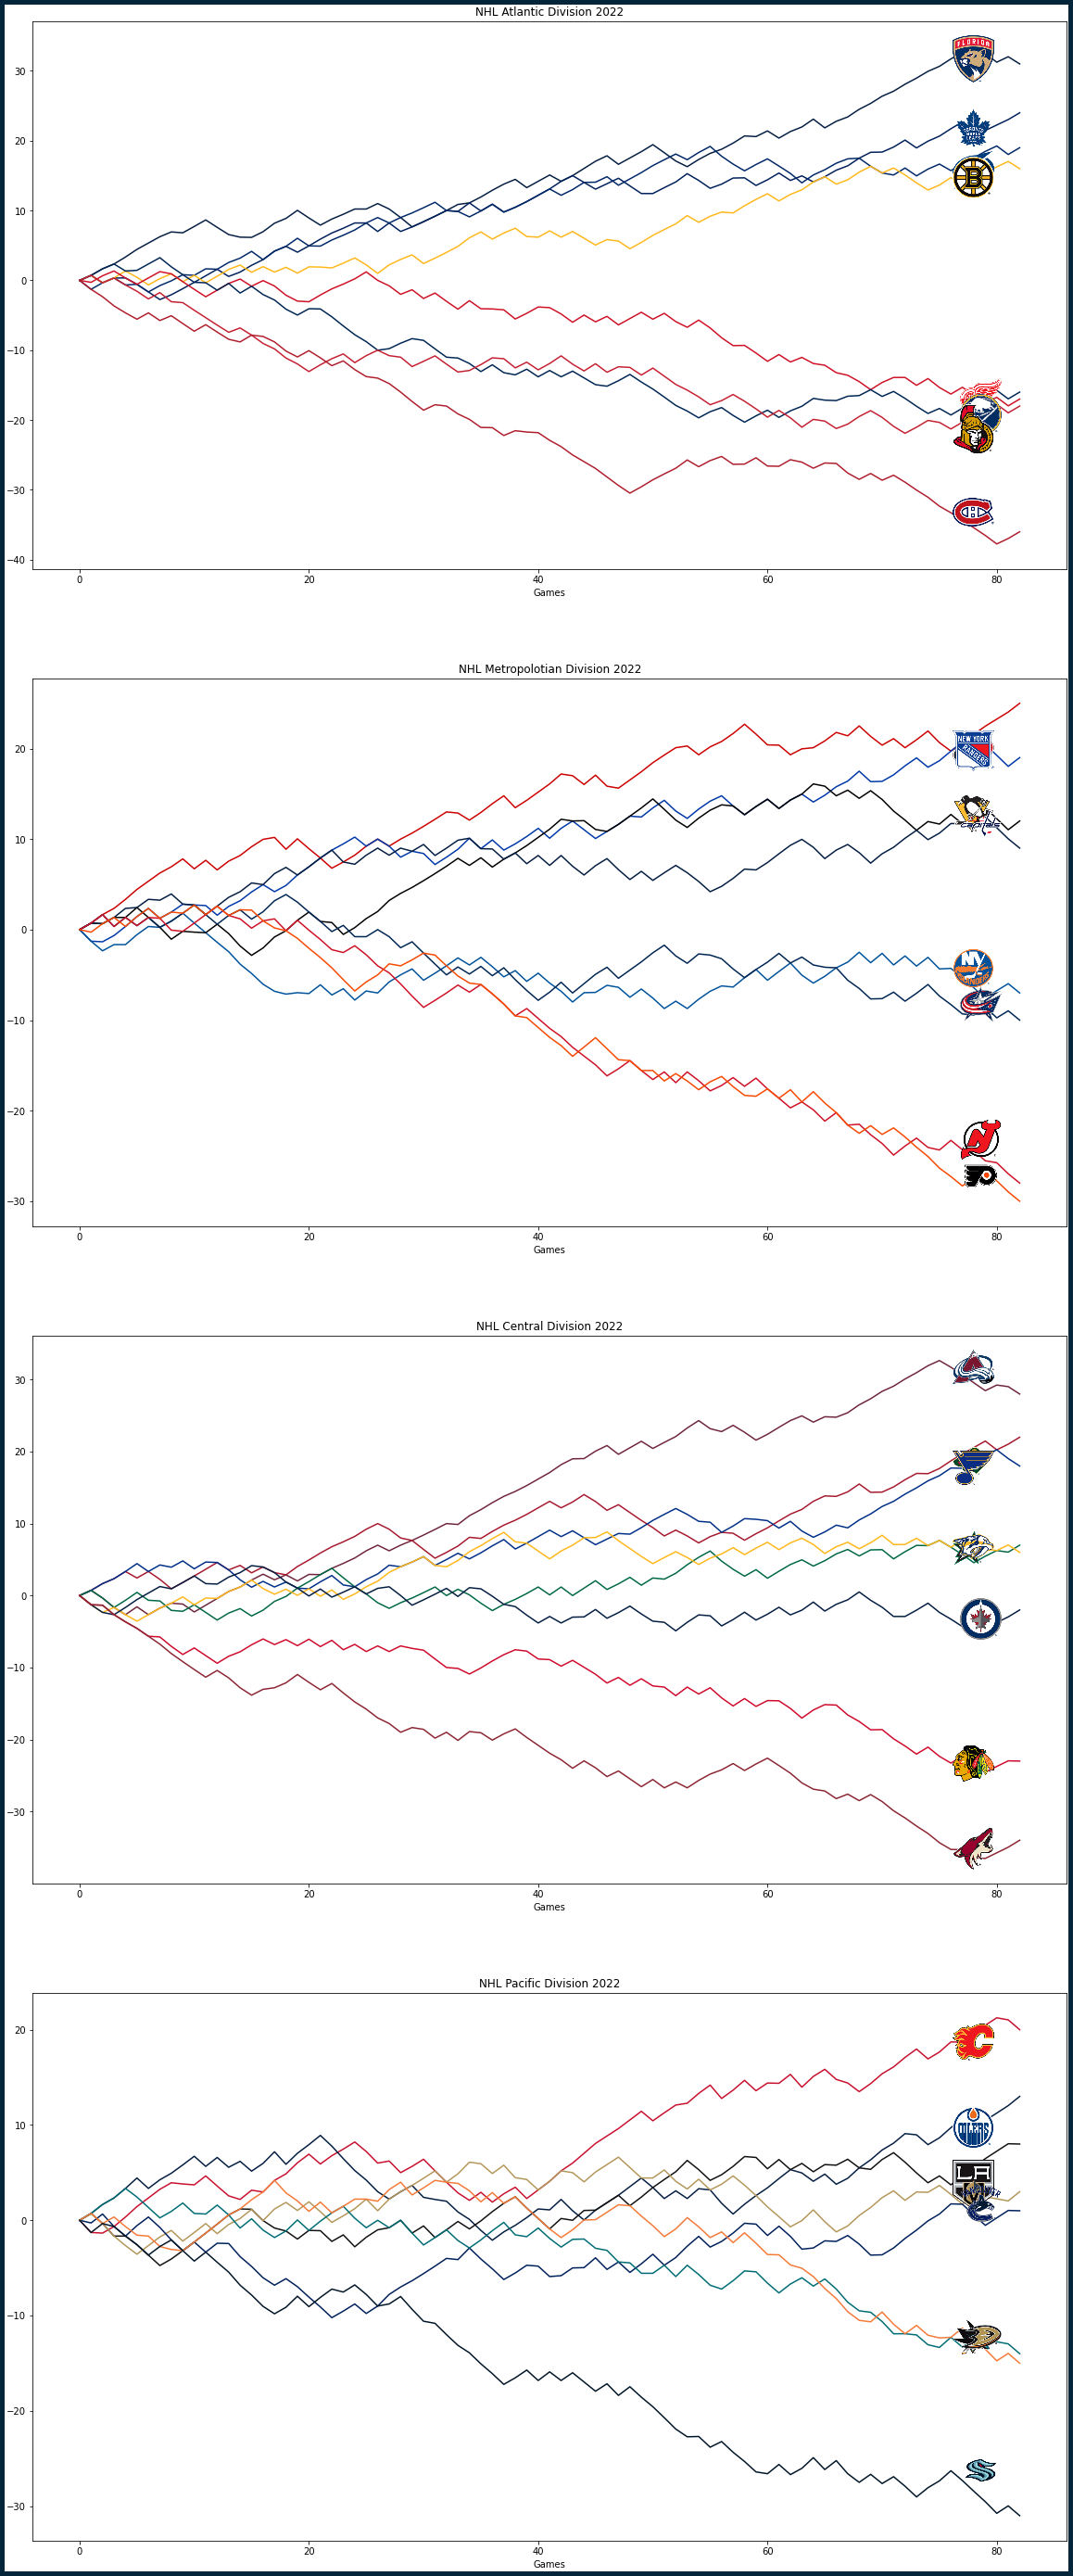
fig, ax = plt.subplots(4,linewidth=10, edgecolor="#04253a")
fig.set_figheight(50)
fig.set_figwidth(20)

for i, div in enumerate(division):
  totalpointsbygame.apply(lambda x: comparetoaverage(x,np.mean(totalpointsbygame, axis = 1))).loc[0:,div].plot(kind = 'line',
                                                                                                                        legend = False,
                                                                                                                        #xlim = [0,15],
                                                                                                                        #ylim = [-10,10],
                                                                                                                        #yticks = range(-10,10,2),
                                                                                                                        color = colors,
                                                                                                                        ax = ax[i])
  dontoverlay = []
  for team in div:
    y = totalpointsbygame.apply(lambda x: comparetoaverage(x,np.mean(totalpointsbygame, axis = 1))).loc[9,team]
    if y in dontoverlay:
      move = .6
    else:
      move = 0
    dontoverlay.append(y)
    arr_lena = plt.imread(linkstub + team + '.png') #needs to be team name +".png"
    imagebox = OffsetImage(arr_lena, zoom=0.3)
    ab = AnnotationBbox(imagebox, (78+move,totalpointsbygame.apply(lambda x: comparetoaverage(x,np.mean(totalpointsbygame, axis = 1))).loc[76,team] ), frameon = False)
    ax[i].add_artist(ab)
  ax[i].set_title("NHL {} Division 2022".format(Divisions[i]))
  ax[i].set(xlabel = 'Games')

plt.show()
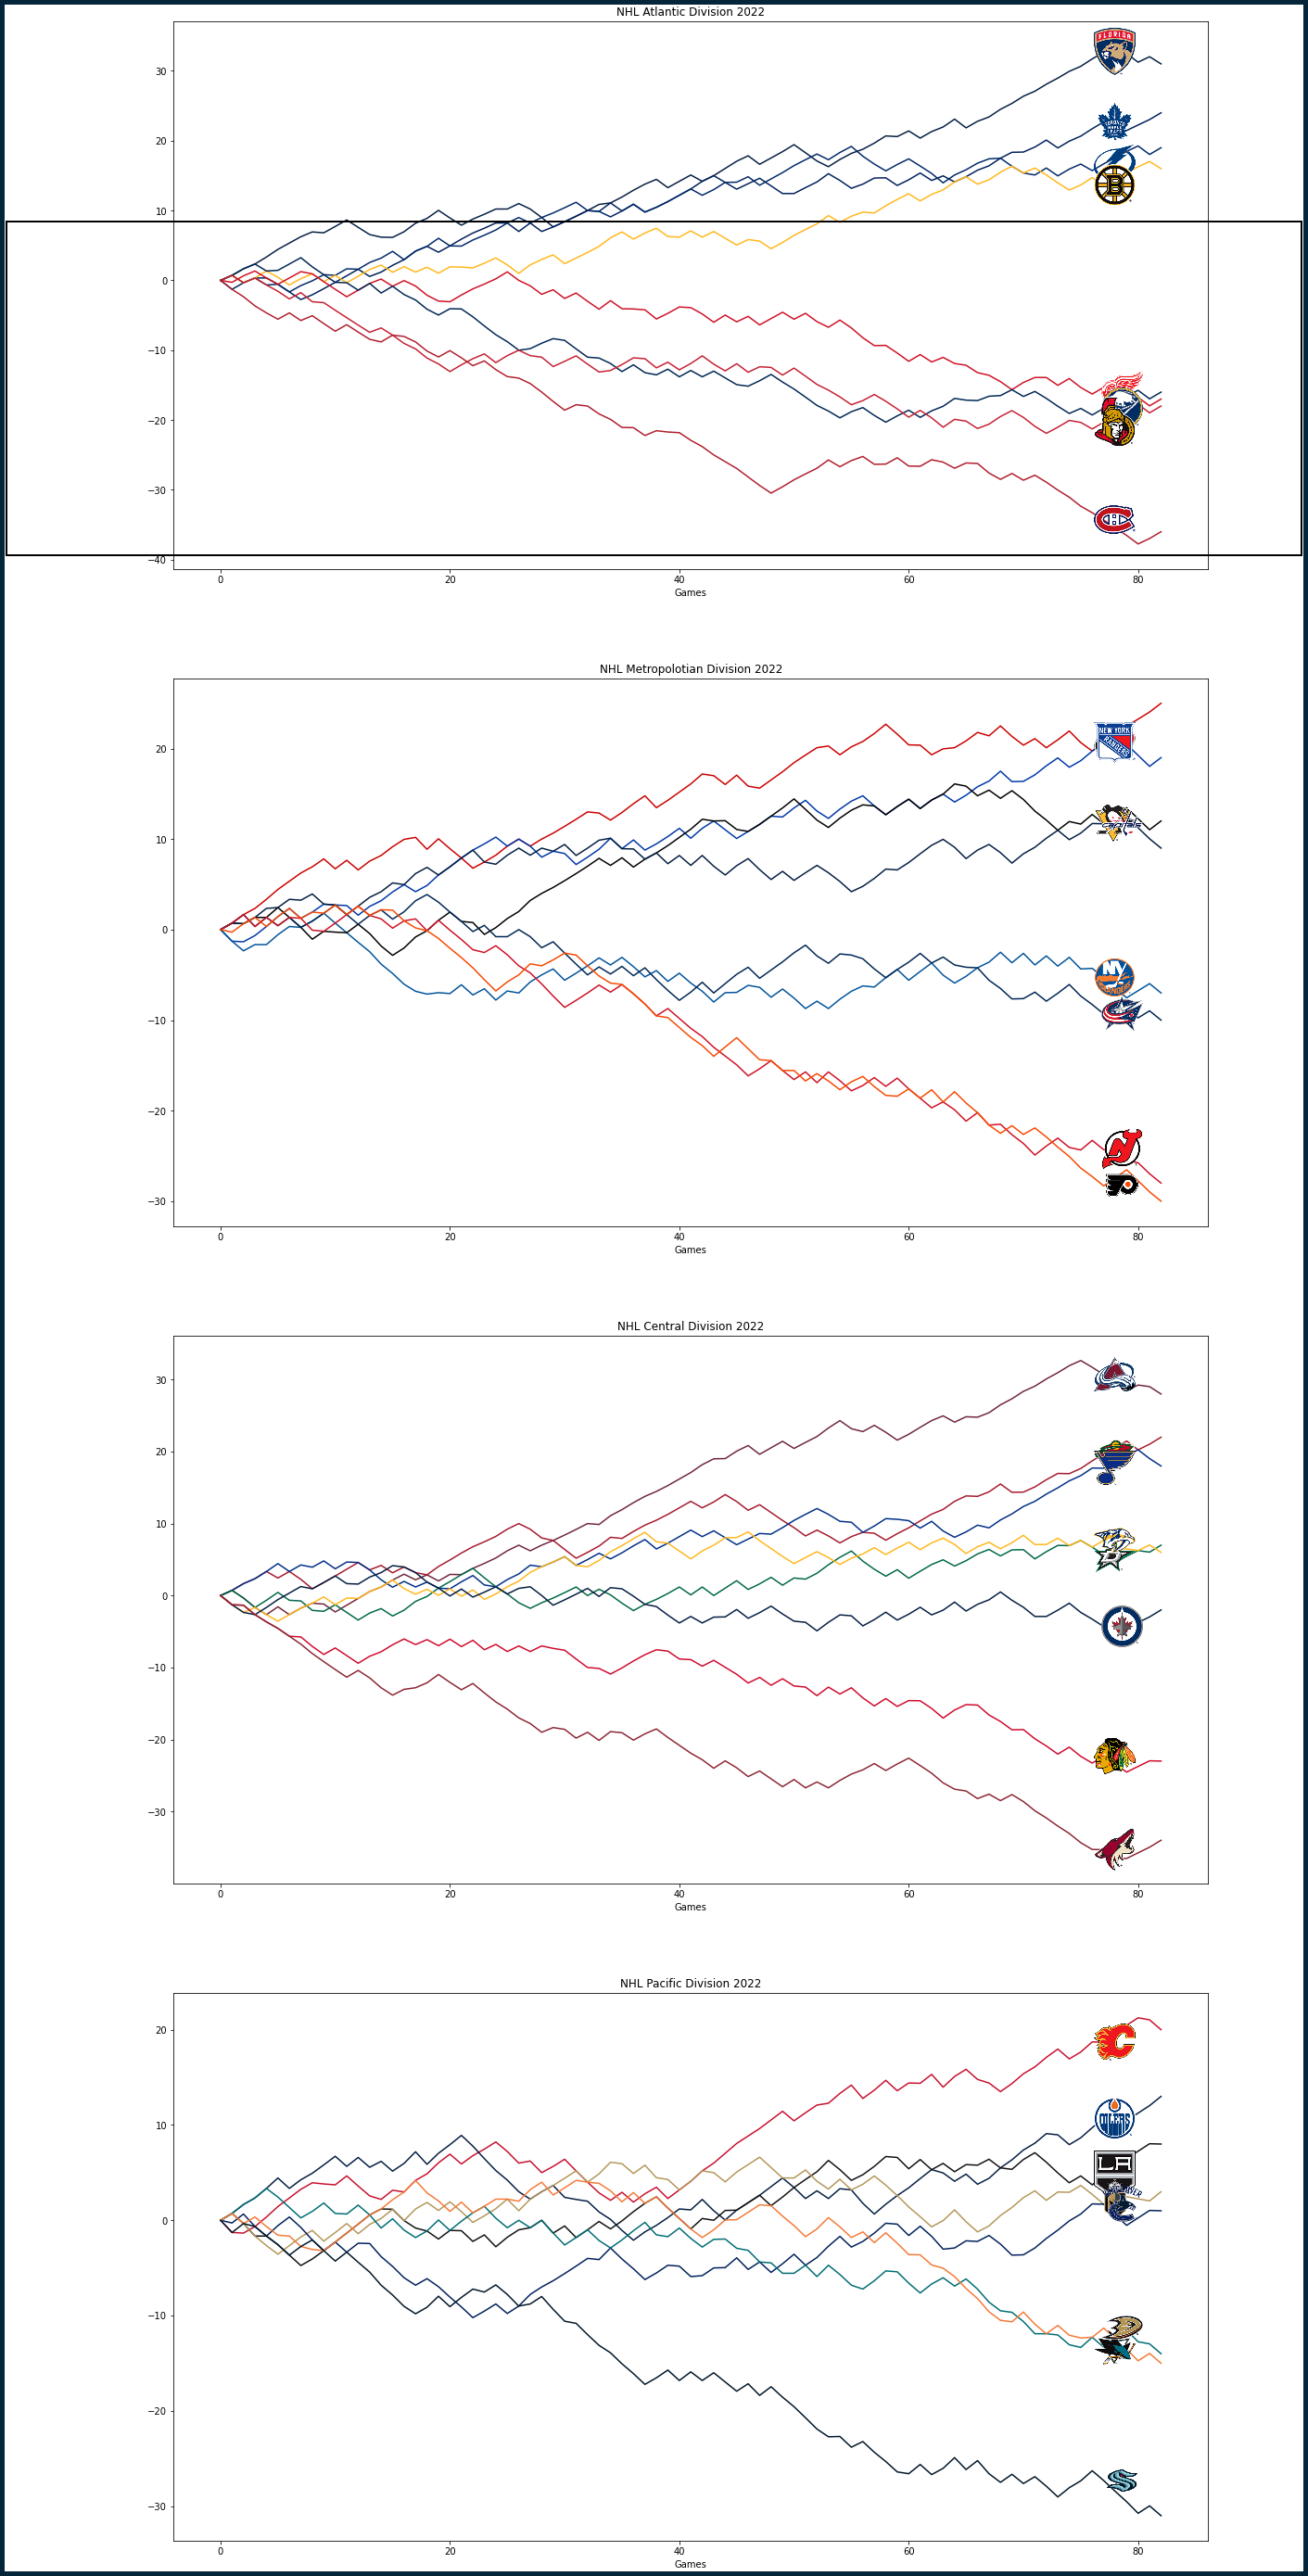
Trying to add the borders.
fig, ax = plt.subplots(4,linewidth=10, edgecolor="#04253a")
fig.set_figheight(50)
fig.set_figwidth(20)

for i, div in enumerate(division):
  totalpointsbygame.apply(lambda x: comparetoaverage(x,np.mean(totalpointsbygame, axis = 1))).loc[0:,div].plot(kind = 'line',
                                                                                                                        legend = False,
                                                                                                                        #xlim = [0,15],
                                                                                                                        #ylim = [-10,10],
                                                                                                                        #yticks = range(-10,10,2),
                                                                                                                        color = colors,
                                                                                                                        ax = ax[i])
  rect = plt.Rectangle(
    # (lower-left corner), width, height
    (0.0, 0.72), 0.97, 0.1, fill=False, color="k", lw=2,
    zorder=1000, transform=fig.transFigure, figure=fig
  )
  fig.patches.extend([rect])
  dontoverlay = []
  for team in div:
    y = totalpointsbygame.apply(lambda x: comparetoaverage(x,np.mean(totalpointsbygame, axis = 1))).loc[9,team]
    if y in dontoverlay:
      move = .6
    else:
      move = 0
    dontoverlay.append(y)
    arr_lena = plt.imread(linkstub + team + '.png') #needs to be team name +".png"
    imagebox = OffsetImage(arr_lena, zoom=0.3)
    ab = AnnotationBbox(imagebox, (78+move,totalpointsbygame.apply(lambda x: comparetoaverage(x,np.mean(totalpointsbygame, axis = 1))).loc[77,team] ), frameon = False)
    ax[i].add_artist(ab)
  ax[i].set_title("NHL {} Division 2022".format(Divisions[i]))
  ax[i].set(xlabel = 'Games')

plt.show()


plt.tight_layout()
<Figure size 432x288 with 0 Axes>
I cannot seem to get the frames to work. Something with the rectangles is just not going to do it. That’s not great but something I should move on from and keep as something I was not able to do.
I am seeing my emblems sit on top of one another. I don’t like that at all so I’ll try to fix that. Before I had used the dontoverlay but that worked well only when the numbers were small (and the graphics too!) I’ll need to look for a range around them!
gamesplayed = (~pa.isnull(totalpointsbygame).loc[1:,]).cumsum(0).max()

fig, ax = plt.subplots(4)
fig.set_figheight(50)
fig.set_figwidth(20)

for i, div in enumerate(division):
  totalpointsbygame.apply(lambda x: comparetoaverage(x,np.mean(totalpointsbygame, axis = 1))).loc[0:,div].plot(kind = 'line',
                                                                                                                        legend = False,
                                                                                                                        xlim = [0,85],
                                                                                                                        #ylim = [-10,10],
                                                                                                                        #yticks = range(-10,10,2),
                                                                                                                        color = colors,
                                                                                                                        ax = ax[i],
                                                                                                                        grid = True)
  for line in ax[i].get_lines():
    line.set_linewidth(7)
  dontoverlay = []
  for team in div:
    y = totalpointsbygame.apply(lambda x: comparetoaverage(x,np.mean(totalpointsbygame, axis = 1))).loc[gamesplayed[team],team]
    testagainstploted = [100]
    for x in dontoverlay:
      testagainstploted.append(x-y)
    if min(np.abs(testagainstploted))<4:
      move = move - 3
    else:
      move = 0
    dontoverlay.append(y)
    arr = plt.imread(linkstub + team + '.png') #needs to be team name +".png"
    imagebox = OffsetImage(arr, zoom=0.25)
    ab = AnnotationBbox(imagebox, (gamesplayed[team] + 1,totalpointsbygame.apply(lambda x: comparetoaverage(x,np.mean(totalpointsbygame, axis = 1))).loc[gamesplayed[team],team]+move-1 ), frameon = False)
    ax[i].add_artist(ab)
  ax[i].set_title("NHL {} Division 2022".format(Divisions[i]))
  ax[i].set(xlabel = 'Games')
  ax[i].axhline(color = 'black')

plt.show()


#plt.tight_layout()
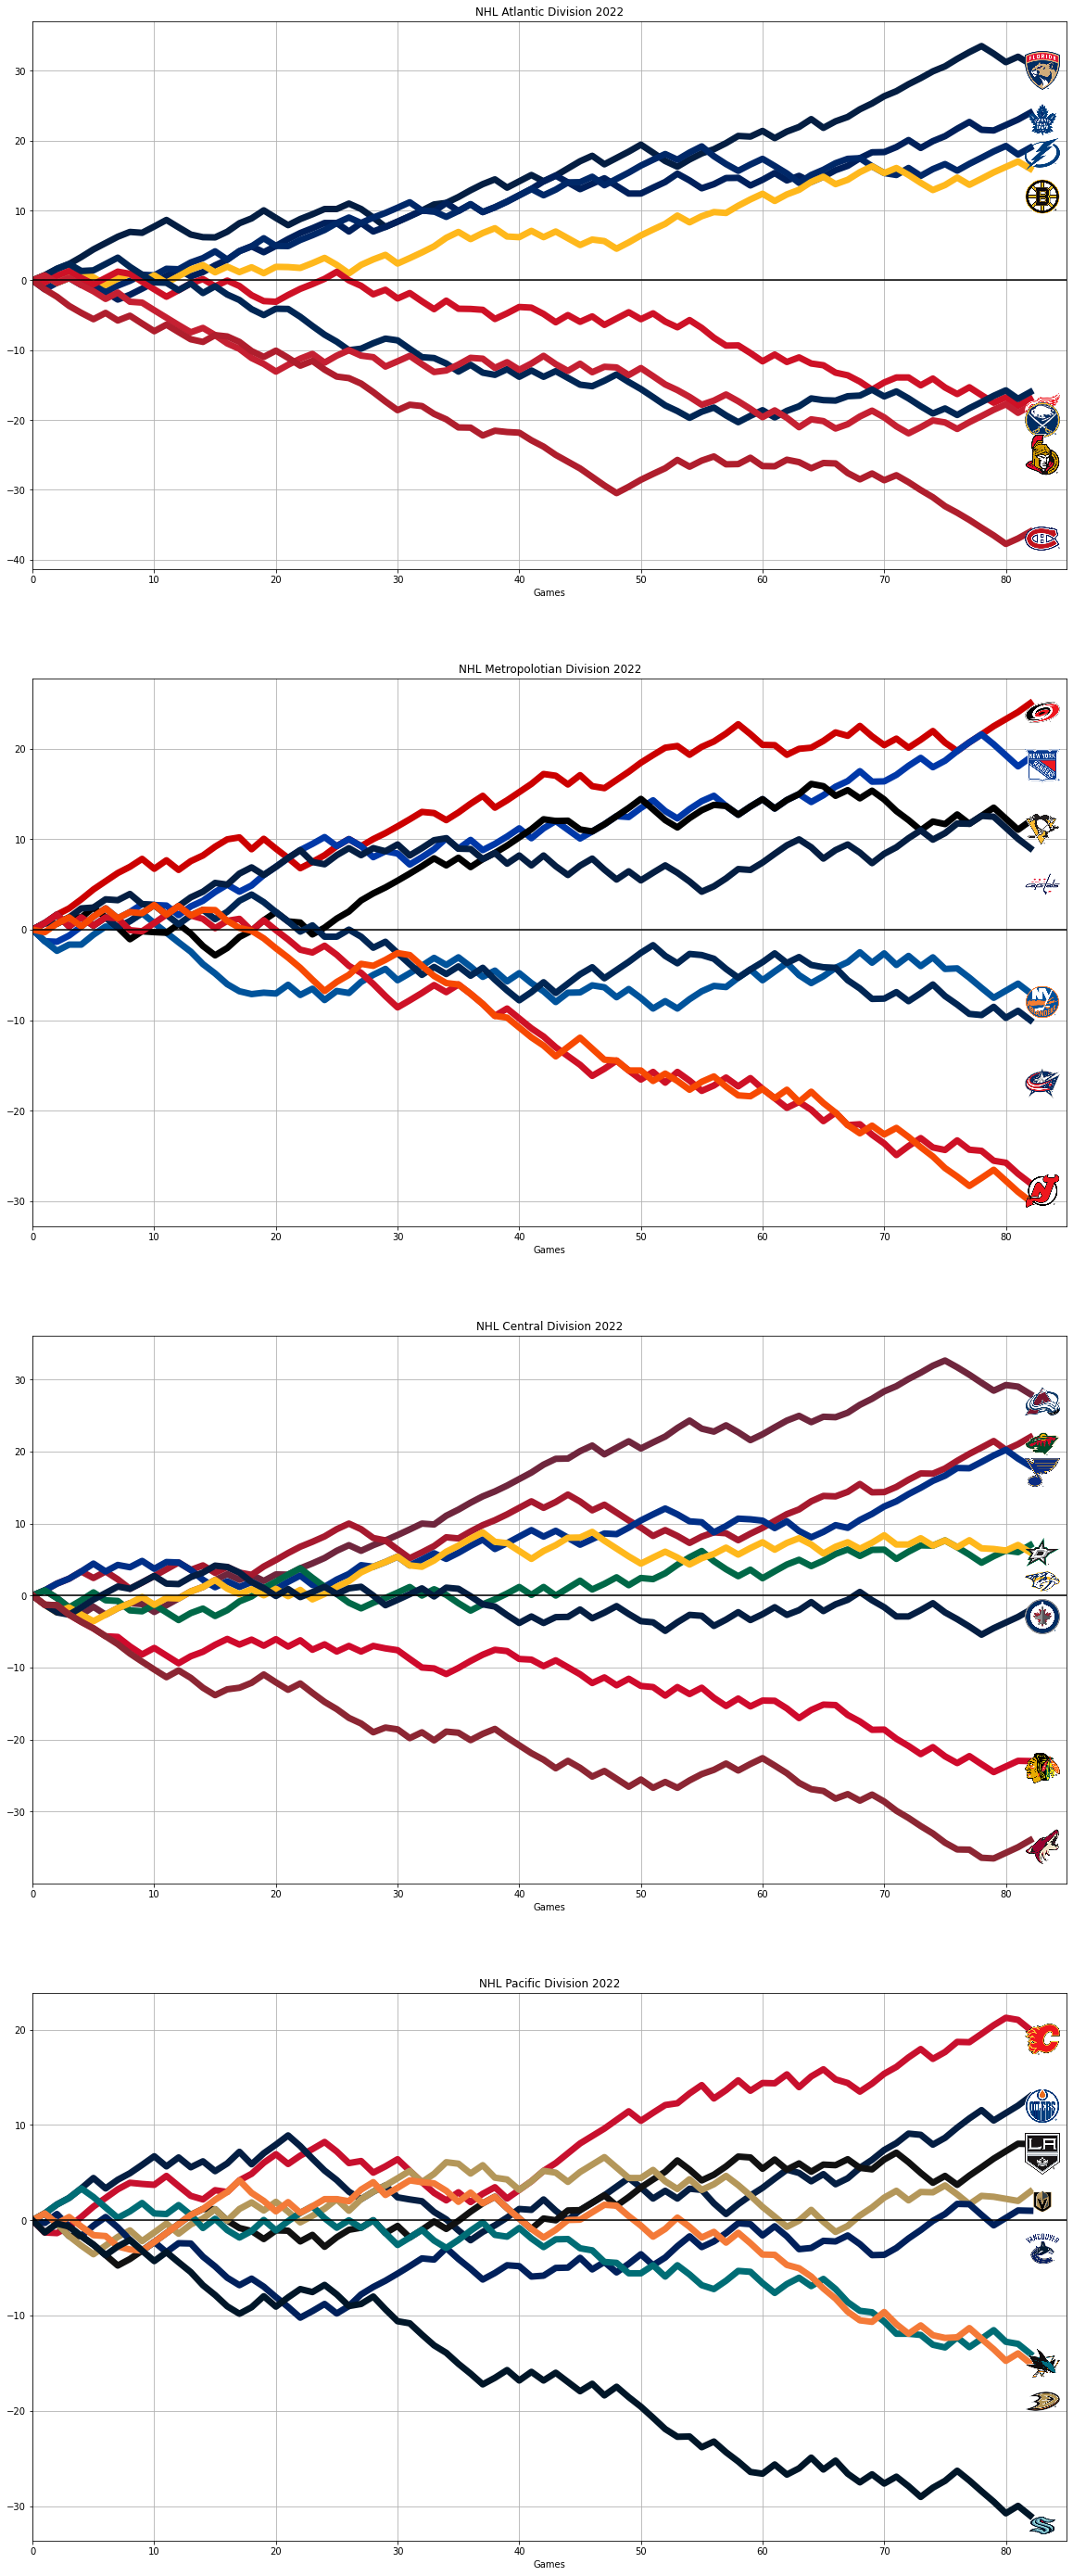
I am not super happy with that outcome either. I have it moving an emblom up regaurdless of whether they are above in the standings.
I did add a clever piece of coding. Not all teams had played the same number of games so I found how many games they had played by counting how many were not null.
(~pa.isnull(totalpointsbygame).loc[1:,]).cumsum(0).max()
tampabaylightning      82
vegasgoldenknights     82
anaheimducks           82
coloradoavalanche      82
edmontonoilers         82
torontomapleleafs      82
washingtoncapitals     82
buffalosabres          82
carolinahurricanes     82
columbusbluejackets    82
detroitredwings        82
floridapanthers        82
losangeleskings        82
nashvillepredators     82
newyorkrangers         82
ottawasenators         82
newjerseydevils        82
philadelphiaflyers     82
bostonbruins           82
montrealcanadiens      82
pittsburghpenguins     82
sanjosesharks          82
arizonacoyotes         82
calgaryflames          82
chicagoblackhawks      82
minnesotawild          82
winnipegjets           82
dallasstars            82
seattlekraken          82
stlouisblues           82
vancouvercanucks       82
newyorkislanders       82
dtype: int64
I keep making changes without doing a new cell. I tweeked the size of the lines, added grids and but the \(x\)-axis on the graph. I also limited the length of the \(x\)-axis so as not to include the negative values.
gamesplayed = (~pa.isnull(totalpointsbygame).loc[1:,]).cumsum(0).max()

fig, ax = plt.subplots(4)
fig.set_figheight(50)
fig.set_figwidth(20)

for i, div in enumerate(division):
  totalpointsbygame.apply(lambda x: comparetoaverage(x,np.mean(totalpointsbygame, axis = 1))).loc[0:,div].plot(kind = 'line',
                                                                                                                        legend = False,
                                                                                                                        xlim = [0,85],
                                                                                                                        #ylim = [-10,10],
                                                                                                                        #yticks = range(-10,10,2),
                                                                                                                        color = colors,
                                                                                                                        ax = ax[i],
                                                                                                                        grid = True)
  for line in ax[i].get_lines():
    line.set_linewidth(7)
  dontoverlay = []
  for team in div:
    y = totalpointsbygame.apply(lambda x: comparetoaverage(x,np.mean(totalpointsbygame, axis = 1))).loc[gamesplayed[team],team]
    testagainstploted = [100]#needed this to be non-empty so put a huge value that will not be achieved by any team.
    for x in dontoverlay:
      testagainstploted.append(x-y)
    if min(np.abs(testagainstploted))<4:
      if min(np.abs(testagainstploted)) in testagainstploted:
        move = move - 2
      else:
        move = move + 2
    else:
      move = 0
    dontoverlay.append(y)
    arr = plt.imread(linkstub + team + '.png') #needs to be team name +".png"
    imagebox = OffsetImage(arr, zoom=0.25)
    ab = AnnotationBbox(imagebox, (gamesplayed[team] + 1,totalpointsbygame.apply(lambda x: comparetoaverage(x,np.mean(totalpointsbygame, axis = 1))).loc[gamesplayed[team],team]+move ), frameon = False)
    ax[i].add_artist(ab)
  ax[i].set_title("NHL {} Division 2022".format(Divisions[i]), fontsize = 30)
  ax[i].set_xlabel('Games', fontsize = 20)
  ax[i].axhline(color = 'black')

plt.show()
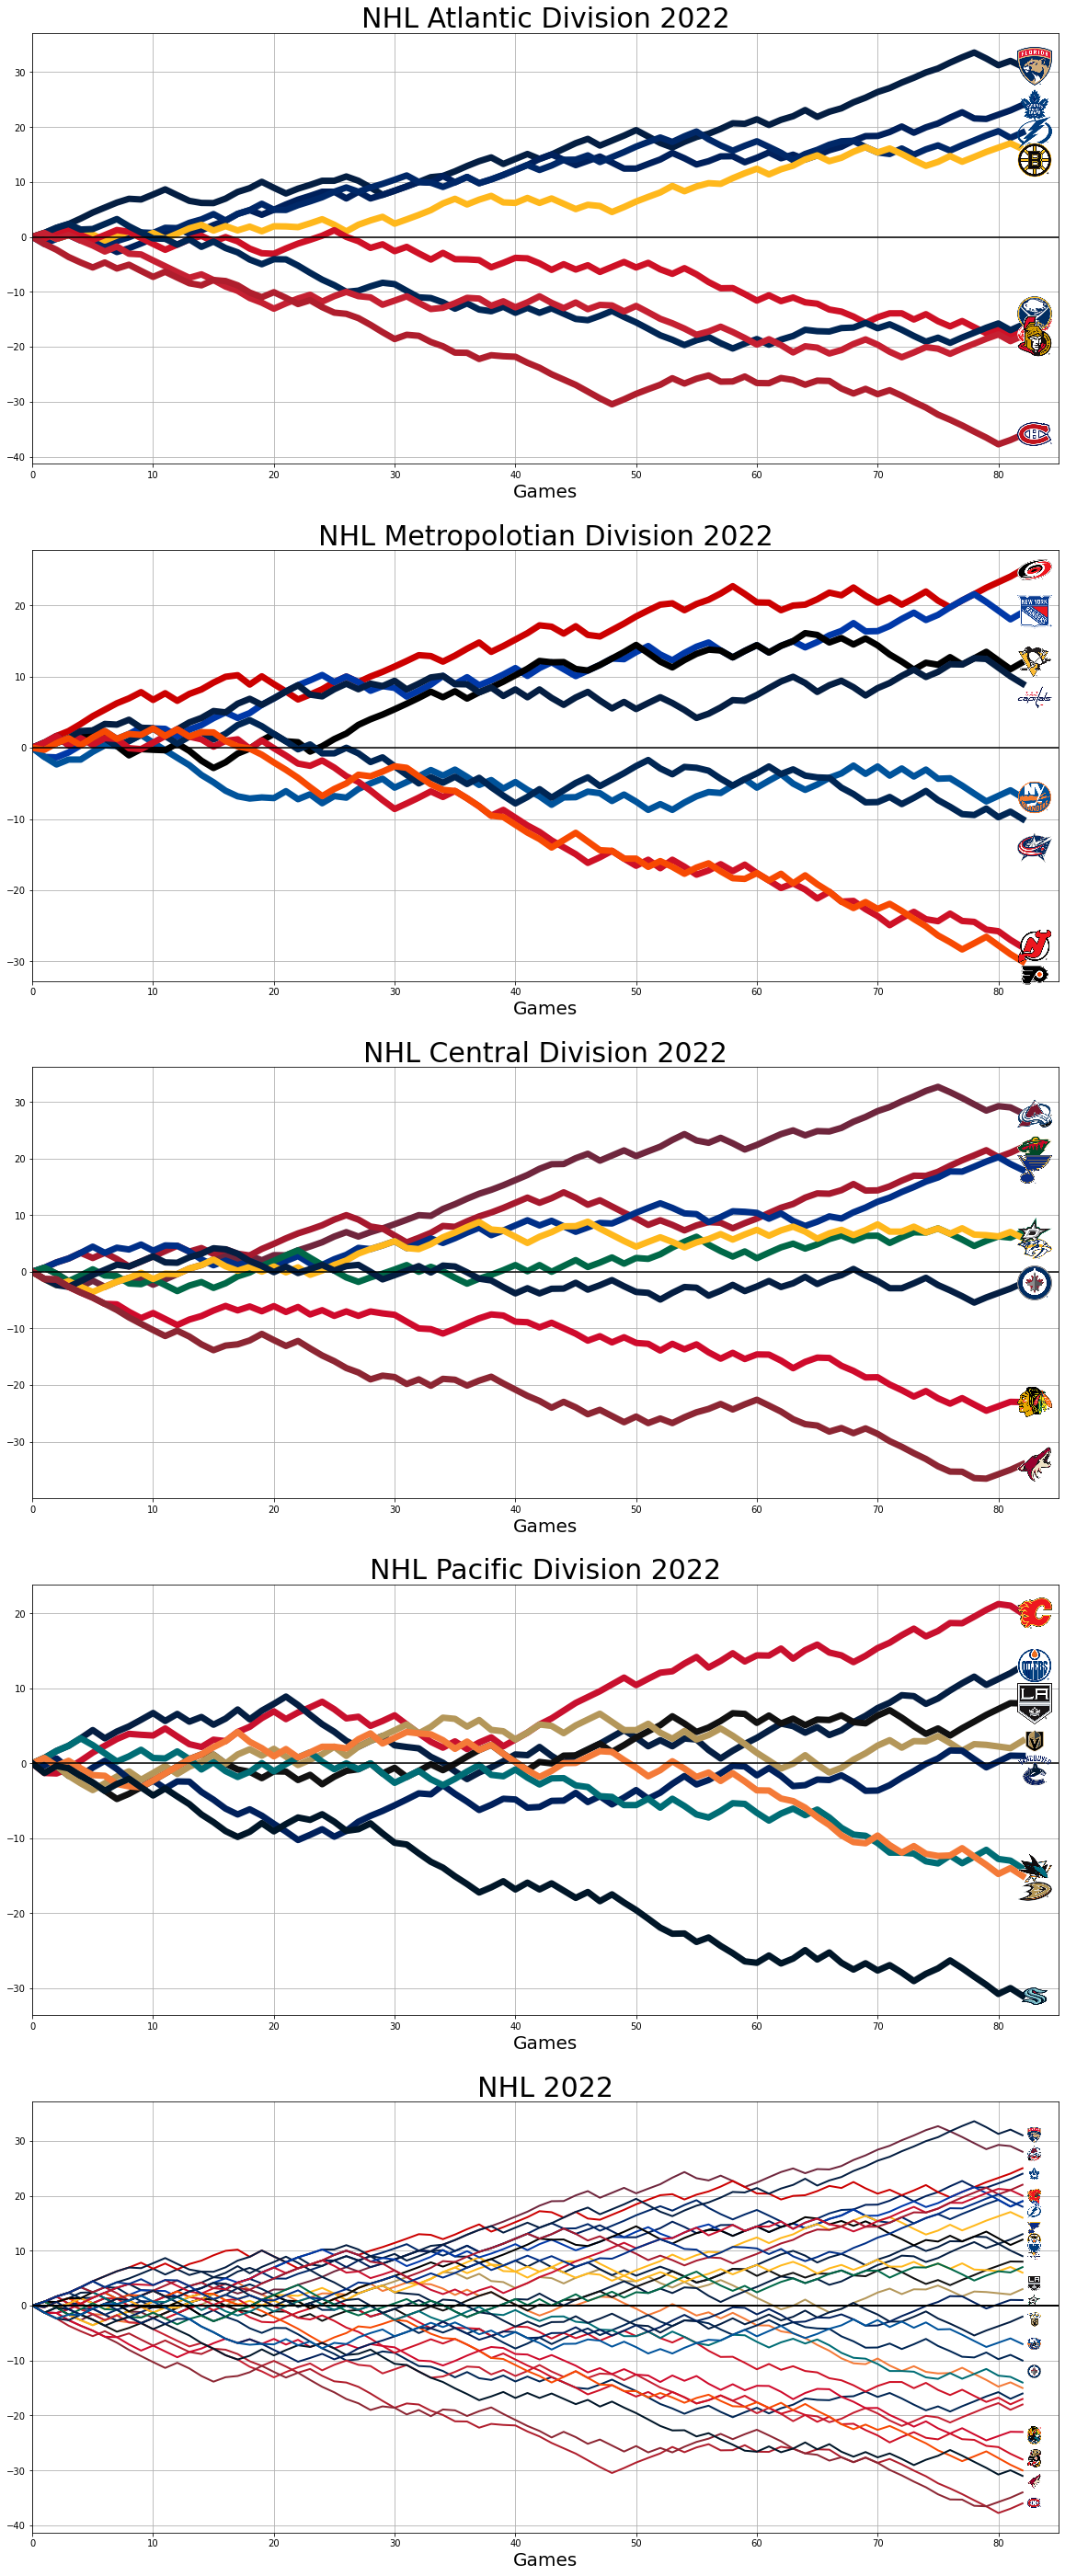
Above I changed font size on the titles and labels. I think I have the embloms not overlapping too bad. I think I am ready to put the big boy on here with all the teams together…
fig, ax = plt.subplots(5)
fig.set_figheight(50)
fig.set_figwidth(20)

for i, div in enumerate(division):
  totalpointsbygame.apply(lambda x: comparetoaverage(x,np.mean(totalpointsbygame, axis = 1))).loc[0:,div].plot(kind = 'line',
                                                                                                                        legend = False,
                                                                                                                        xlim = [0,85],
                                                                                                                        #ylim = [-10,10],
                                                                                                                        #yticks = range(-10,10,2),
                                                                                                                        color = colors,
                                                                                                                        ax = ax[i],
                                                                                                                        grid = True)
  for line in ax[i].get_lines():
    line.set_linewidth(7)
  dontoverlay = []
  for team in div:
    y = totalpointsbygame.apply(lambda x: comparetoaverage(x,np.mean(totalpointsbygame, axis = 1))).loc[gamesplayed[team],team]
    testagainstploted = [100]#needed this to be non-empty so put a huge value that will not be achieved by any team.
    for x in dontoverlay:
      testagainstploted.append(x-y)
    if min(np.abs(testagainstploted))<4:
      if min(np.abs(testagainstploted)) in testagainstploted:
        move = move - 2
      else:
        move = move + 2
    else:
      move = 0
    dontoverlay.append(y)
    arr = plt.imread(linkstub + team + '.png') #needs to be team name +".png"
    imagebox = OffsetImage(arr, zoom=0.25)
    ab = AnnotationBbox(imagebox, (gamesplayed[team] + 1,totalpointsbygame.apply(lambda x: comparetoaverage(x,np.mean(totalpointsbygame, axis = 1))).loc[gamesplayed[team],team]+move ), frameon = False)
    ax[i].add_artist(ab)
  ax[i].set_title("NHL {} Division 2022".format(Divisions[i]), fontsize = 30)
  ax[i].set_xlabel('Games', fontsize = 20)
  ax[i].axhline(color = 'black')
### Adding all teams together
totalpointsbygame.apply(lambda x: comparetoaverage(x,np.mean(totalpointsbygame, axis = 1))).loc[0:,:].plot(kind = 'line',
                                                                                                                        legend = False,
                                                                                                                        xlim = [0,85],
                                                                                                                        #ylim = [-10,10],
                                                                                                                        #yticks = range(-10,10,2),
                                                                                                                        color = colors,
                                                                                                                        ax = ax[4],
                                                                                                                        grid = True)
for div in division:
  for team in div:
      y = totalpointsbygame.apply(lambda x: comparetoaverage(x,np.mean(totalpointsbygame, axis = 1))).loc[gamesplayed[team],team]
      testagainstploted = [100]#needed this to be non-empty so put a huge value that will not be achieved by any team.
      for x in dontoverlay:
        testagainstploted.append(x-y)
      if min(np.abs(testagainstploted))<4:
        if min(np.abs(testagainstploted)) in testagainstploted:
          move = move - 2
        else:
          move = move + 2
      else:
        move = 0
      dontoverlay.append(y)
      arr = plt.imread(linkstub + team + '.png') #needs to be team name +".png"
      imagebox = OffsetImage(arr, zoom=0.1)
      ab = AnnotationBbox(imagebox, (gamesplayed[team] + 1,totalpointsbygame.apply(lambda x: comparetoaverage(x,np.mean(totalpointsbygame, axis = 1))).loc[gamesplayed[team],team]+move ), frameon = False)
      ax[4].add_artist(ab)
ax[4].set_title("NHL 2022", fontsize = 30)
ax[4].set_xlabel('Games', fontsize = 20)
ax[4].axhline(color = 'black')
for line in ax[4].get_lines():
  line.set_linewidth(2)
plt.show()
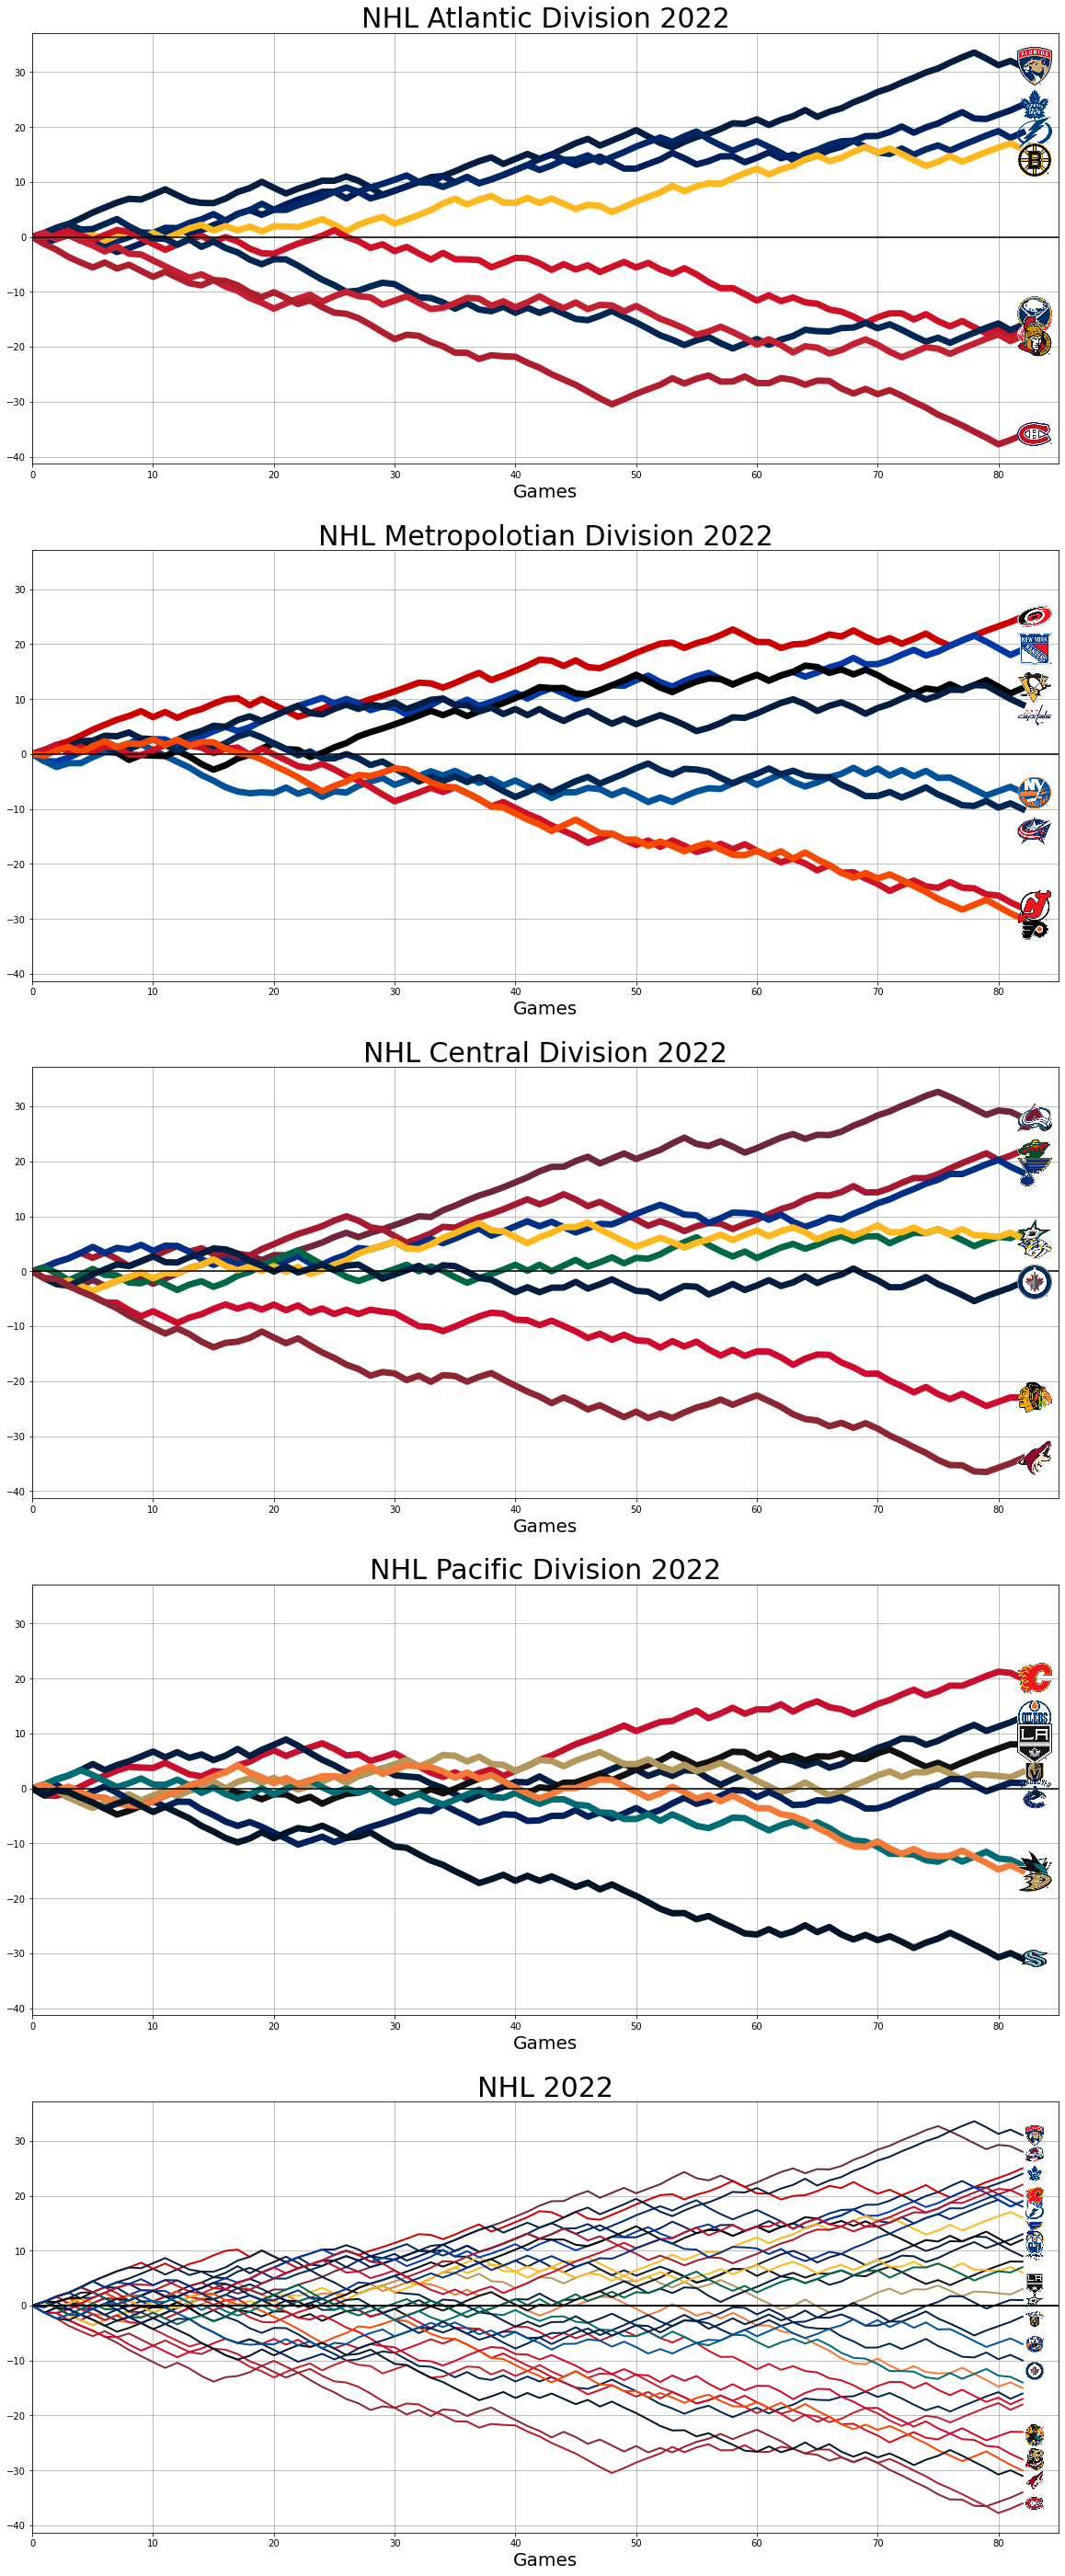
fig, ax = plt.subplots(5, sharey = True)
fig.set_figheight(50)
fig.set_figwidth(20)


for i, div in enumerate(division):
  totalpointsbygame.apply(lambda x: comparetoaverage(x,np.mean(totalpointsbygame, axis = 1))).loc[0:,div].plot(kind = 'line',
                                                                                                                        legend = False,
                                                                                                                        xlim = [0,85],
                                                                                                                        #ylim = [-10,10],
                                                                                                                        #yticks = range(-10,10,2),
                                                                                                                        color = colors,
                                                                                                                        ax = ax[i],
                                                                                                                        grid = True)
  for line in ax[i].get_lines():
    line.set_linewidth(7)
  dontoverlay = []
  for team in div:
    y = totalpointsbygame.apply(lambda x: comparetoaverage(x,np.mean(totalpointsbygame, axis = 1))).loc[gamesplayed[team],team]
    testagainstploted = [100]#needed this to be non-empty so put a huge value that will not be achieved by any team.
    for x in dontoverlay:
      testagainstploted.append(x-y)
    if min(np.abs(testagainstploted))<4:
      if min(np.abs(testagainstploted)) in testagainstploted:
        move = move - 2
      else:
        move = move + 2
    else:
      move = 0
    dontoverlay.append(y)
    arr = plt.imread(linkstub + team + '.png') #needs to be team name +".png"
    imagebox = OffsetImage(arr, zoom=0.25)
    ab = AnnotationBbox(imagebox, (gamesplayed[team] + 1,totalpointsbygame.apply(lambda x: comparetoaverage(x,np.mean(totalpointsbygame, axis = 1))).loc[gamesplayed[team],team]+move ), frameon = False)
    ax[i].add_artist(ab)
  ax[i].set_title("NHL {} Division 2022".format(Divisions[i]), fontsize = 30)
  ax[i].set_xlabel('Games', fontsize = 20)
  ax[i].axhline(color = 'black')
### Adding all teams together
totalpointsbygame.apply(lambda x: comparetoaverage(x,np.mean(totalpointsbygame, axis = 1))).loc[0:,:].plot(kind = 'line',
                                                                                                                        legend = False,
                                                                                                                        xlim = [0,85],
                                                                                                                        #ylim = [-10,10],
                                                                                                                        #yticks = range(-10,10,2),
                                                                                                                        color = colors,
                                                                                                                        ax = ax[4],
                                                                                                                        grid = True)
for div in division:
  for team in div:
      y = totalpointsbygame.apply(lambda x: comparetoaverage(x,np.mean(totalpointsbygame, axis = 1))).loc[gamesplayed[team],team]
      testagainstploted = [100]#needed this to be non-empty so put a huge value that will not be achieved by any team.
      for x in dontoverlay:
        testagainstploted.append(x-y)
      if min(np.abs(testagainstploted))<4:
        if min(np.abs(testagainstploted)) in testagainstploted:
          move = move - 2
        else:
          move = move + 2
      else:
        move = 0
      dontoverlay.append(y)
      arr = plt.imread(linkstub + team + '.png') #needs to be team name +".png"
      imagebox = OffsetImage(arr, zoom=0.13)
      ab = AnnotationBbox(imagebox, (gamesplayed[team] + 1,totalpointsbygame.apply(lambda x: comparetoaverage(x,np.mean(totalpointsbygame, axis = 1))).loc[gamesplayed[team],team]+move ), frameon = False)
      ax[4].add_artist(ab)
ax[4].set_title("NHL 2022", fontsize = 30)
ax[4].set_xlabel('Games', fontsize = 20)
ax[4].axhline(color = 'black')
for line in ax[4].get_lines():
  line.set_linewidth(2)
plt.show()
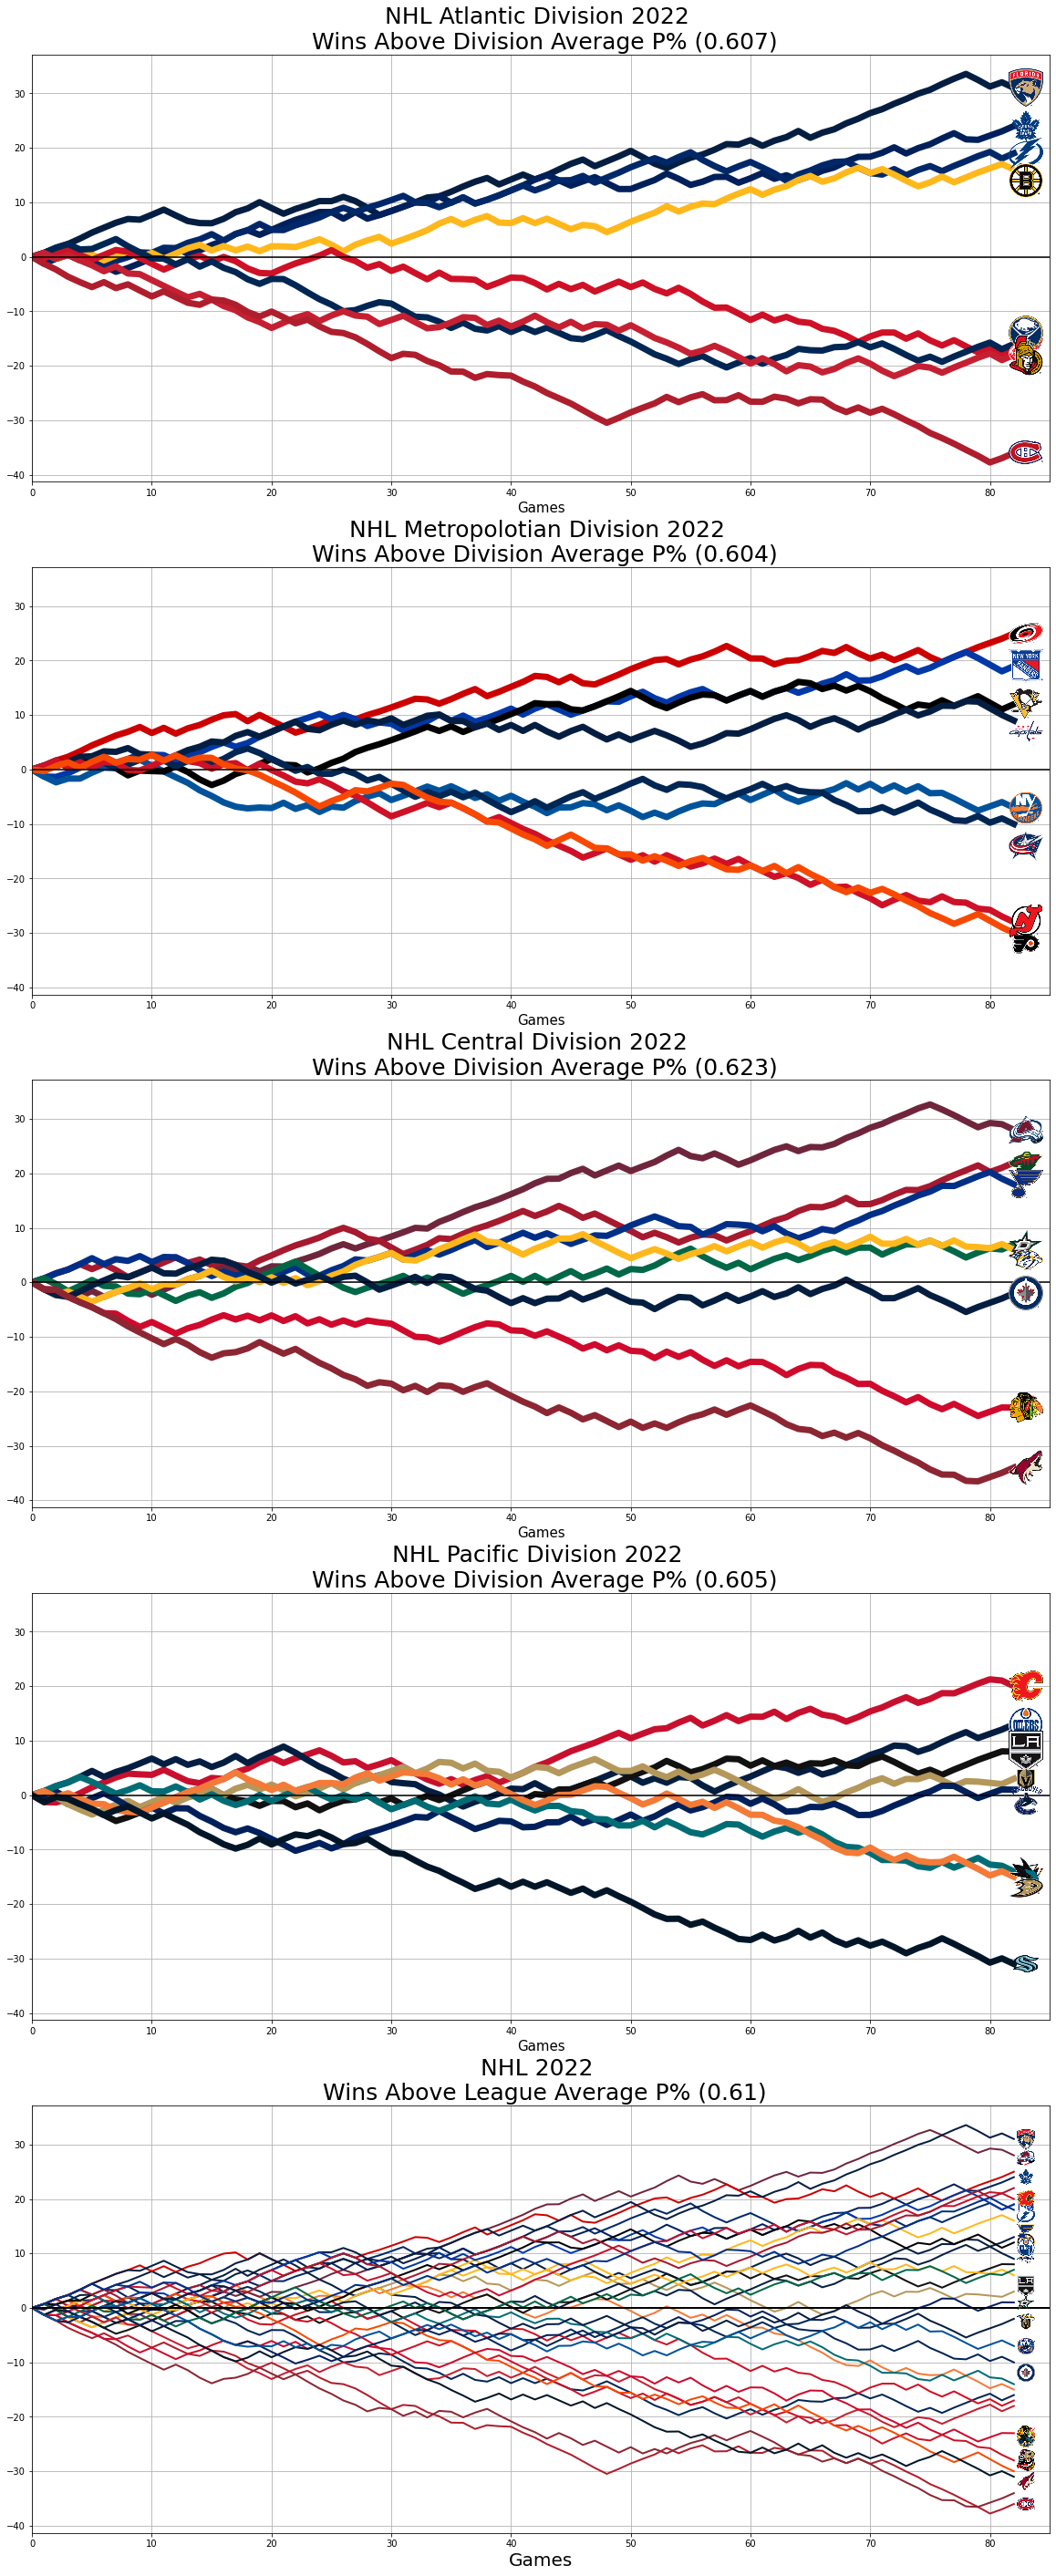
I still need to figure out the percentage of points that are expected. Then I should be able to pass that as a percentage to a sub-title for each of my outputs. Let’s see what we can do.
expected = [i for i in range(1,83)] #one point per game is the expected.
centralstand = []


actual = [totalpointsbygame.loc[78,team] for team in central]
expected = [78 for team in central]

(sum(actual) - sum(expected))/(78*4)
0.26282051282051283
What is clear to me is that I didn;t know what the P% was. I think it is the point percentage or the percentage of games that a team gets points.
np.mean([i>0 for i in stlouisblues])
0.7317073170731707
divavg = []
for team in central:
  divavg.append(np.mean([i>0 for i in globals()[team]]))

np.mean(divavg)
0.6234756097560976
There it is! Let’s add that back in!
fig, ax = plt.subplots(5, sharey = True)
fig.set_figheight(50)
fig.set_figwidth(20)
lgavg = []

for i, div in enumerate(division):
  divavg = []
  totalpointsbygame.apply(lambda x: comparetoaverage(x,np.mean(totalpointsbygame, axis = 1))).loc[0:,div].plot(kind = 'line',
                                                                                                                        legend = False,
                                                                                                                        xlim = [0,85],
                                                                                                                        #ylim = [-10,10],
                                                                                                                        #yticks = range(-10,10,2),
                                                                                                                        color = colors,
                                                                                                                        ax = ax[i],
                                                                                                                        grid = True)
  for line in ax[i].get_lines():
    line.set_linewidth(7)
  dontoverlay = []
  for team in div:
    divavg.append(np.mean([i>0 for i in globals()[team]]))
    y = totalpointsbygame.apply(lambda x: comparetoaverage(x,np.mean(totalpointsbygame, axis = 1))).loc[gamesplayed[team],team]
    testagainstploted = [100]#needed this to be non-empty so put a huge value that will not be achieved by any team.
    for x in dontoverlay:
      testagainstploted.append(x-y)
    if min(np.abs(testagainstploted))<4:
      if min(np.abs(testagainstploted)) in testagainstploted:
        move = move - 2
      else:
        move = move + 2
    else:
      move = 0
    dontoverlay.append(y)
    arr = plt.imread(linkstub + team + '.png') #needs to be team name +".png"
    imagebox = OffsetImage(arr, zoom=0.25)
    ab = AnnotationBbox(imagebox, (gamesplayed[team] + 1,totalpointsbygame.apply(lambda x: comparetoaverage(x,np.mean(totalpointsbygame, axis = 1))).loc[gamesplayed[team],team]+move ), frameon = False)
    ax[i].add_artist(ab)
  P = np.mean(divavg)
  lgavg.append(P)
  ax[i].set_title("NHL {} Division 2022 \n Wins Above Division Average P% ({})".format(Divisions[i],round(P,3)), fontsize = 25)
  ax[i].set_xlabel('Games', fontsize = 15)
  ax[i].axhline(color = 'black')


### Adding all teams together
totalpointsbygame.apply(lambda x: comparetoaverage(x,np.mean(totalpointsbygame, axis = 1))).loc[0:,:].plot(kind = 'line',
                                                                                                                        legend = False,
                                                                                                                        xlim = [0,85],
                                                                                                                        #ylim = [-10,10],
                                                                                                                        #yticks = range(-10,10,2),
                                                                                                                        color = colors,
                                                                                                                        ax = ax[4],
                                                                                                                        grid = True)
for div in division:
  for team in div:
      y = totalpointsbygame.apply(lambda x: comparetoaverage(x,np.mean(totalpointsbygame, axis = 1))).loc[gamesplayed[team],team]
      testagainstploted = [100]#needed this to be non-empty so put a huge value that will not be achieved by any team.
      for x in dontoverlay:
        testagainstploted.append(x-y)
      if min(np.abs(testagainstploted))<4:
        if min(np.abs(testagainstploted)) in testagainstploted:
          move = move - 2
        else:
          move = move + 2
      else:
        move = 0
      dontoverlay.append(y)
      arr = plt.imread(linkstub + team + '.png') #needs to be team name +".png"
      imagebox = OffsetImage(arr, zoom=0.13)
      ab = AnnotationBbox(imagebox, (gamesplayed[team] + 1,totalpointsbygame.apply(lambda x: comparetoaverage(x,np.mean(totalpointsbygame, axis = 1))).loc[gamesplayed[team],team]+move ), frameon = False)
      ax[4].add_artist(ab)
ax[4].set_title("NHL 2022 \n Wins Above League Average P% ({})".format(round(np.mean(lgavg),3)), fontsize = 25)
ax[4].set_xlabel('Games', fontsize = 20)
ax[4].axhline(color = 'black')
for line in ax[4].get_lines():
  line.set_linewidth(2)
plt.show()
Adding Text Box#
fig, ax = plt.subplots(5, sharey = True)
fig.set_figheight(50)
fig.set_figwidth(15)
lgavg = []

for i, div in enumerate(division):
  divavg = []
  totalpointsbygame.apply(lambda x: comparetoaverage(x,np.mean(totalpointsbygame, axis = 1))).loc[0:,div].plot(kind = 'line',
                                                                                                                        legend = False,
                                                                                                                        xlim = [0,85],
                                                                                                                        #ylim = [-10,10],
                                                                                                                        #yticks = range(-10,10,2),
                                                                                                                        color = colors,
                                                                                                                        ax = ax[i],
                                                                                                                        grid = True)
  for line in ax[i].get_lines():
    line.set_linewidth(7)
  dontoverlay = []
  for team in div:
    divavg.append(np.mean([i>0 for i in globals()[team]]))
    y = totalpointsbygame.apply(lambda x: comparetoaverage(x,np.mean(totalpointsbygame, axis = 1))).loc[gamesplayed[team],team]
    testagainstploted = [100]#needed this to be non-empty so put a huge value that will not be achieved by any team.
    for x in dontoverlay:
      testagainstploted.append(x-y)
    if min(np.abs(testagainstploted))<4:
      if min(np.abs(testagainstploted)) in testagainstploted:
        move = move - 2
      else:
        move = move + 2
    else:
      move = 0
    dontoverlay.append(y)
    arr = plt.imread(linkstub + team + '.png') #needs to be team name +".png"
    imagebox = OffsetImage(arr, zoom=0.25)
    ab = AnnotationBbox(imagebox, (gamesplayed[team] + 1,totalpointsbygame.apply(lambda x: comparetoaverage(x,np.mean(totalpointsbygame, axis = 1))).loc[gamesplayed[team],team]+move ), frameon = False)
    ax[i].add_artist(ab)
  P = np.mean(divavg)
  lgavg.append(P)
  ax[i].set_title("NHL {} Division 2022 \n Wins Above Division Average P% ({})".format(Divisions[i],round(P,3)), fontsize = 25)
  ax[i].set_xlabel('Games', fontsize = 15)
  ax[i].axhline(color = 'black')


### Adding all teams together
totalpointsbygame.apply(lambda x: comparetoaverage(x,np.mean(totalpointsbygame, axis = 1))).loc[0:,:].plot(kind = 'line',
                                                                                                                        legend = False,
                                                                                                                        xlim = [0,85],
                                                                                                                        #ylim = [-10,10],
                                                                                                                        #yticks = range(-10,10,2),
                                                                                                                        color = colors,
                                                                                                                        ax = ax[4],
                                                                                                                        grid = True)
for div in division:
  for team in div:
      y = totalpointsbygame.apply(lambda x: comparetoaverage(x,np.mean(totalpointsbygame, axis = 1))).loc[gamesplayed[team],team]
      testagainstploted = [100]#needed this to be non-empty so put a huge value that will not be achieved by any team.
      for x in dontoverlay:
        testagainstploted.append(x-y)
      if min(np.abs(testagainstploted))<4:
        if min(np.abs(testagainstploted)) in testagainstploted:
          move = move - 2
        else:
          move = move + 2
      else:
        move = 0
      dontoverlay.append(y)
      arr = plt.imread(linkstub + team + '.png') #needs to be team name +".png"
      imagebox = OffsetImage(arr, zoom=0.13)
      ab = AnnotationBbox(imagebox, (gamesplayed[team] + 1,totalpointsbygame.apply(lambda x: comparetoaverage(x,np.mean(totalpointsbygame, axis = 1))).loc[gamesplayed[team],team]+move ), frameon = False)
      ax[4].add_artist(ab)
ax[4].set_title("NHL 2022 \n Wins Above League Average P% ({})".format(round(np.mean(lgavg),3)), fontsize = 25)
ax[4].set_xlabel('Games', fontsize = 20)
ax[4].axhline(color = 'black')
for line in ax[4].get_lines():
  line.set_linewidth(2)

text = fig.text(0, .01,
    'The Y-Axis is the number of wins above or below the average P%. E.g., a team at a minus-five can climb back up to zero with a five-game win streak.\n\n The average P% varies with the number of OT games.  In a typical season, 22% to 24% of games go into OT, and the average P% is between .555 and .560',
    horizontalalignment='left',
    fontsize = 15,
    wrap=True) # I am not getting this text to wrap, just made the font size smaller so as not to extend the box out too much
fig.tight_layout(rect=(0,.05,1,1))
plt.show()
Change Background Colors#
fig, ax = plt.subplots(5, sharey = True)
fig.set_figheight(50)
fig.set_figwidth(15)
lgavg = []


for i, div in enumerate(division):
  divavg = []
  totalpointsbygame.apply(lambda x: comparetoaverage(x,np.mean(totalpointsbygame, axis = 1))).loc[0:,div].plot(kind = 'line',
                                                                                                                        legend = False,
                                                                                                                        xlim = [0,85],
                                                                                                                        #ylim = [-10,10],
                                                                                                                        #yticks = range(-10,10,2),
                                                                                                                        color = colors,
                                                                                                                        ax = ax[i],
                                                                                                                        grid = True)
  for line in ax[i].get_lines():
    line.set_linewidth(7)
  dontoverlay = []
  for team in div:
    divavg.append(np.mean([i>0 for i in globals()[team]]))
    y = totalpointsbygame.apply(lambda x: comparetoaverage(x,np.mean(totalpointsbygame, axis = 1))).loc[gamesplayed[team],team]
    testagainstploted = [100]#needed this to be non-empty so put a huge value that will not be achieved by any team.
    for x in dontoverlay:
      testagainstploted.append(x-y)
    if min(np.abs(testagainstploted))<4:
      if min(np.abs(testagainstploted)) in testagainstploted:
        move = move - 2
      else:
        move = move + 2
    else:
      move = 0
    dontoverlay.append(y)
    arr = plt.imread(linkstub + team + '.png') #needs to be team name +".png"
    imagebox = OffsetImage(arr, zoom=0.25)
    ab = AnnotationBbox(imagebox, (gamesplayed[team] + 1,totalpointsbygame.apply(lambda x: comparetoaverage(x,np.mean(totalpointsbygame, axis = 1))).loc[gamesplayed[team],team]+move ), frameon = False)
    ax[i].add_artist(ab)
  P = np.mean(divavg)
  lgavg.append(P)
  ax[i].set_title("NHL {} Division 2022 \n Wins Above Division Average P% ({})".format(Divisions[i],round(P,3)), fontsize = 25)
  ax[i].set_xlabel('Games', fontsize = 15)
  ax[i].axhline(color = 'black')
  ax[i].set_facecolor('whitesmoke')


### Adding all teams together
totalpointsbygame.apply(lambda x: comparetoaverage(x,np.mean(totalpointsbygame, axis = 1))).loc[0:,:].plot(kind = 'line',
                                                                                                                        legend = False,
                                                                                                                        xlim = [0,85],
                                                                                                                        #ylim = [-10,10],
                                                                                                                        #yticks = range(-10,10,2),
                                                                                                                        color = colors,
                                                                                                                        ax = ax[4],
                                                                                                                        grid = True)
for div in division:
  for team in div:
      y = totalpointsbygame.apply(lambda x: comparetoaverage(x,np.mean(totalpointsbygame, axis = 1))).loc[gamesplayed[team],team]
      testagainstploted = [100]#needed this to be non-empty so put a huge value that will not be achieved by any team.
      for x in dontoverlay:
        testagainstploted.append(x-y)
      if min(np.abs(testagainstploted))<4:
        if min(np.abs(testagainstploted)) in testagainstploted:
          move = move - 2
        else:
          move = move + 2
      else:
        move = 0
      dontoverlay.append(y)
      arr = plt.imread(linkstub + team + '.png') #needs to be team name +".png"
      imagebox = OffsetImage(arr, zoom=0.13)
      ab = AnnotationBbox(imagebox, (gamesplayed[team] + 1,totalpointsbygame.apply(lambda x: comparetoaverage(x,np.mean(totalpointsbygame, axis = 1))).loc[gamesplayed[team],team]+move ), frameon = False)
      ax[4].add_artist(ab)
ax[4].set_title("NHL 2022 \n Wins Above League Average P% ({})".format(round(np.mean(lgavg),3)), fontsize = 25)
ax[4].set_xlabel('Games', fontsize = 20)
ax[4].axhline(color = 'black')
ax[4].set_facecolor('whitesmoke')
for line in ax[4].get_lines():
  line.set_linewidth(2)

text = fig.text(0, .01,
    'The Y-Axis is the number of wins above or below the average P%. E.g., a team at a minus-five can climb back up to zero with a five-game win streak.\n\n The average P% varies with the number of OT games.  In a typical season, 22% to 24% of games go into OT, and the average P% is between .555 and .560',
    horizontalalignment='left',
    fontsize = 15,
    wrap=True) # I am not getting this text to wrap, just made the font size smaller so as not to extend the box out too much
fig.tight_layout(rect=(0,.05,1,1))
plt.show()
Trying For Borders One More Time#
The method described here seems useable. Let’s see!
fig, ax = plt.subplots(5, sharey = True)
fig.set_figheight(50)
fig.set_figwidth(15)
lgavg = []


for i, div in enumerate(division):
  divavg = []
  totalpointsbygame.apply(lambda x: comparetoaverage(x,np.mean(totalpointsbygame, axis = 1))).loc[0:,div].plot(kind = 'line',
                                                                                                                        legend = False,
                                                                                                                        xlim = [0,85],
                                                                                                                        ylim = [-80,80],
                                                                                                                        #yticks = range(-10,10,2),
                                                                                                                        color = colors,
                                                                                                                        ax = ax[i],
                                                                                                                        grid = True)
  for line in ax[i].get_lines():
    line.set_linewidth(7)
  dontoverlay = []
  for team in div:
    divavg.append(np.mean([i>0 for i in globals()[team]]))
    y = totalpointsbygame.apply(lambda x: comparetoaverage(x,np.mean(totalpointsbygame, axis = 1))).loc[gamesplayed[team],team]
    testagainstploted = [100]#needed this to be non-empty so put a huge value that will not be achieved by any team.
    for x in dontoverlay:
      testagainstploted.append(x-y)
    if min(np.abs(testagainstploted))<4:
      if min(np.abs(testagainstploted)) in testagainstploted:
        move = move - 2
      else:
        move = move + 2
    else:
      move = 0
    dontoverlay.append(y)
    arr = plt.imread(linkstub + team + '.png') #needs to be team name +".png"
    imagebox = OffsetImage(arr, zoom=0.25)
    ab = AnnotationBbox(imagebox, (gamesplayed[team] + 1,totalpointsbygame.apply(lambda x: comparetoaverage(x,np.mean(totalpointsbygame, axis = 1))).loc[gamesplayed[team],team]+move ), frameon = False)
    ax[i].add_artist(ab)
  P = np.mean(divavg)
  lgavg.append(P)
  ax[i].set_title("NHL {} Division 2022 \n Wins Above Division Average P% ({})".format(Divisions[i],round(P,3)), fontsize = 25)
  ax[i].set_xlabel('Games', fontsize = 15)
  ax[i].axhline(color = 'black')
  ax[i].set_facecolor('whitesmoke')
  edges = ax[i].axis()
  rec = plt.Rectangle((edges[0] - 5, -91), (edges[1] - edges[0]) + 10, (edges[3] - edges[2]) + 27.5, fill=False, lw=10)
  rec = ax[i].add_patch(rec)
  rec.set_clip_on(False)


### Adding all teams together
totalpointsbygame.apply(lambda x: comparetoaverage(x,np.mean(totalpointsbygame, axis = 1))).loc[0:,:].plot(kind = 'line',
                                                                                                                        legend = False,
                                                                                                                        xlim = [0,85],
                                                                                                                        ylim = [-80,80],
                                                                                                                        #yticks = range(-10,10,2),
                                                                                                                        color = colors,
                                                                                                                        ax = ax[4],
                                                                                                                        grid = True)
for div in division:
  for team in div:
      y = totalpointsbygame.apply(lambda x: comparetoaverage(x,np.mean(totalpointsbygame, axis = 1))).loc[gamesplayed[team],team]
      testagainstploted = [100]#needed this to be non-empty so put a huge value that will not be achieved by any team.
      for x in dontoverlay:
        testagainstploted.append(x-y)
      if min(np.abs(testagainstploted))<4:
        if min(np.abs(testagainstploted)) in testagainstploted:
          move = move - 2
        else:
          move = move + 2
      else:
        move = 0
      dontoverlay.append(y)
      arr = plt.imread(linkstub + team + '.png') #needs to be team name +".png"
      imagebox = OffsetImage(arr, zoom=0.13)
      ab = AnnotationBbox(imagebox, (gamesplayed[team] + 1,totalpointsbygame.apply(lambda x: comparetoaverage(x,np.mean(totalpointsbygame, axis = 1))).loc[gamesplayed[team],team]+move ), frameon = False)
      ax[4].add_artist(ab)
ax[4].set_title("NHL 2022 \n Wins Above League Average P% ({})".format(round(np.mean(lgavg),3)), fontsize = 25)
ax[4].set_xlabel('Games', fontsize = 20)
ax[4].axhline(color = 'black')
ax[4].set_facecolor('whitesmoke')
edges = ax[4].axis()
rec = plt.Rectangle((edges[0] - 5, -91), (edges[1] - edges[0]) + 10, (edges[3] - edges[2]) + 27.5, fill=False, lw=10)
rec = ax[4].add_patch(rec)
rec.set_clip_on(False)

for line in ax[4].get_lines():
  line.set_linewidth(2)

text = fig.text(0, .01,
    'The Y-Axis is the number of wins above or below the average P%. E.g., a team at a minus-five can climb back up to zero with a five-game win streak.\n\n The average P% varies with the number of OT games.  In a typical season, 22% to 24% of games go into OT, and the average P% is between .555 and .560',
    horizontalalignment='left',
    fontsize = 15,
    wrap=True) # I am not getting this text to wrap, just made the font size smaller so as not to extend the box out too much

rec = plt.Rectangle((0,.01), 105, 30, fill=False, lw=10)


fig.tight_layout(rect=(0,.05,1,1))
plt.show()