
![]()
Gathering Data Conclusion#
At this point you should be able to gather data from:
A CSV or Excel file
SQL databases
HTML tables
Twitter
From all that data that you have gathered you should be able to do some basic manipulations on it using pandas or sql langauge.
To prepare yourself for the exam, attempt the following problems:
Use the SQL table
bigquery-public-data.london_fire_brigade.fire_brigade_service_callsHow many entries are there in the dataset
How many False Alarms happened between 10PM and 5 AM?
What is the average number of num_pumps_attending when there is a Fire?
What is the largest number of num_pumps_attending to a Road Vehicle property_category
How many fires had more than average number of pumps attending?
Navigate to the Oklahoma wikipedia page. Grab the table on tempuratures in largest cities. I’ve included some code below for cleaning up that table.
What is the average monthly high temperature for OKC?
Create a plot of the average monthly low tempurature in Tulsa.
Identify the city with the highest high tempurature in each month.
Code for cleaning up table in #2 is below. Make sure to scrape the table and call it df.
df = df.melt(id_vars = ['City','Unnamed: 1'],
                  value_vars = df.columns[2:],
                  var_name = 'month'
)

df.value = df.value.apply(lambda s: int(s[:2]))

df.columns = ['City','Low_High', 'Month','Temp_F']

df
My Solutions#
SQL#
from google.colab import auth
auth.authenticate_user()
print('Authenticated')
Authenticated
How many total rows are there?
%%bigquery --project pic-math
SELECT
  COUNT(*) as total_rows
FROM `bigquery-public-data.london_fire_brigade.fire_brigade_service_calls`
| total_rows | |
|---|---|
| 0 | 32247 |
Here I am peaking at the data.
%%bigquery --project pic-math
SELECT *
FROM `bigquery-public-data.london_fire_brigade.fire_brigade_service_calls`
LIMIT 10
| incident_number | date_of_call | cal_year | time_of_call | hour_of_call | timestamp_of_call | incident_group | stop_code_description | special_service_type | property_category | property_type | address_qualifier | postcode_full | postcode_district | borough_code | borough_name | proper_case | ward_code | ward_name | ward_name_new | easting_m | northing_m | easting_rounded | northing_rounded | frs | incident_station_ground | first_pump_arriving_attendance_time | first_pump_arriving_deployed_from_station | second_pump_arriving_attendance_time | second_pump_arriving_deployed_from_station | num_stations_with_pumps_attending | num_pumps_attending | |
|---|---|---|---|---|---|---|---|---|---|---|---|---|---|---|---|---|---|---|---|---|---|---|---|---|---|---|---|---|---|---|---|---|
| 0 | 000320-01012017 | 2017-01-01 | 2017 | 15:30:22 | 15 | 2017-01-01 15:30:22+00:00 | False Alarm | AFA | None | Dwelling | Purpose Built Flats/Maisonettes - Up to 3 stor... | Within same building | None | IG9 | E00000000 | NOT GEO-CODED | Not geo-coded | E00000000 | Not geo-coded | Not geo-coded | NaN | NaN | 541450 | 194050 | OverTheBorder | OverTheBorder | None | None | None | None | 2 | 2 |
| 1 | 003727-09012017 | 2017-01-09 | 2017 | 10:41:54 | 10 | 2017-01-09 10:41:54+00:00 | False Alarm | AFA | None | Dwelling | House - single occupancy | Correct incident location | None | IG7 | E00000000 | NOT GEO-CODED | Not geo-coded | E00000000 | Not geo-coded | Not geo-coded | NaN | NaN | 543650 | 192950 | OverTheBorder | OverTheBorder | None | None | None | None | 2 | 2 |
| 2 | 003762-09012017 | 2017-01-09 | 2017 | 12:28:39 | 12 | 2017-01-09 12:28:39+00:00 | False Alarm | AFA | None | Dwelling | House - single occupancy | Correct incident location | None | IG7 | E00000000 | NOT GEO-CODED | Not geo-coded | E00000000 | Not geo-coded | Not geo-coded | NaN | NaN | 543650 | 192950 | OverTheBorder | OverTheBorder | None | None | None | None | 2 | 2 |
| 3 | 006403-16012017 | 2017-01-16 | 2017 | 04:02:14 | 4 | 2017-01-16 04:02:14+00:00 | False Alarm | AFA | None | Dwelling | Purpose Built Flats/Maisonettes - Up to 3 stor... | Correct incident location | None | IG7 | E00000000 | NOT GEO-CODED | Not geo-coded | E00000000 | Not geo-coded | Not geo-coded | NaN | NaN | 544350 | 192250 | OverTheBorder | OverTheBorder | None | None | None | None | 2 | 2 |
| 4 | 010947-26012017 | 2017-01-26 | 2017 | 11:14:03 | 11 | 2017-01-26 11:14:03+00:00 | False Alarm | AFA | None | Dwelling | House - single occupancy | Correct incident location | None | IG10 | E00000000 | NOT GEO-CODED | Not geo-coded | E00000000 | Not geo-coded | Not geo-coded | NaN | NaN | 542050 | 196450 | OverTheBorder | OverTheBorder | None | None | None | None | 1 | 1 |
| 5 | 014169-03022017 | 2017-02-03 | 2017 | 04:58:02 | 4 | 2017-02-03 04:58:02+00:00 | False Alarm | AFA | None | Dwelling | Converted Flat/Maisonettes - 3 or more storeys | Correct incident location | None | TN14 | E00000000 | NOT GEO-CODED | Not geo-coded | E00000000 | Not geo-coded | Not geo-coded | NaN | NaN | 548750 | 157750 | OverTheBorder | OverTheBorder | None | None | None | None | 3 | 5 |
| 6 | 016263-08022017 | 2017-02-08 | 2017 | 09:47:05 | 9 | 2017-02-08 09:47:05+00:00 | False Alarm | AFA | None | Dwelling | House - single occupancy | Correct incident location | None | IG7 | E00000000 | NOT GEO-CODED | Not geo-coded | E00000000 | Not geo-coded | Not geo-coded | NaN | NaN | 544150 | 192550 | OverTheBorder | OverTheBorder | None | None | None | None | 2 | 2 |
| 7 | 016865-09022017 | 2017-02-09 | 2017 | 18:40:43 | 18 | 2017-02-09 18:40:43+00:00 | False Alarm | AFA | None | Non Residential | Warehouse | Correct incident location | UB9 5HJ | UB9 | E00000000 | NOT GEO-CODED | Not geo-coded | E00000000 | Not geo-coded | Not geo-coded | 504201.0 | 188280.0 | 504250 | 188250 | OverTheBorder | OverTheBorder | None | None | None | None | 1 | 1 |
| 8 | 017092-10022017 | 2017-02-10 | 2017 | 10:07:53 | 10 | 2017-02-10 10:07:53+00:00 | False Alarm | AFA | None | Non Residential | Factory | Correct incident location | UB9 5HJ | UB9 | E00000000 | NOT GEO-CODED | Not geo-coded | E00000000 | Not geo-coded | Not geo-coded | 504287.0 | 188271.0 | 504250 | 188250 | OverTheBorder | OverTheBorder | None | None | None | None | 1 | 1 |
| 9 | 024609-27022017 | 2017-02-27 | 2017 | 09:34:33 | 9 | 2017-02-27 09:34:33+00:00 | False Alarm | AFA | None | Dwelling | Converted Flat/Maisonette - Up to 2 storeys | Correct incident location | None | CR3 | E00000000 | NOT GEO-CODED | Not geo-coded | E00000000 | Not geo-coded | Not geo-coded | NaN | NaN | 537650 | 155050 | OverTheBorder | OverTheBorder | None | None | None | None | 1 | 1 |
To find ‘False Alarms’ between certain hours, I will use the WHERE command and join several clauses carefully with AND and OR
%%bigquery --project pic-math
SELECT COUNT(*) as number_of_late_night_false_alarms
FROM `bigquery-public-data.london_fire_brigade.fire_brigade_service_calls`
WHERE incident_group = "False Alarm" AND (hour_of_call >= 22 OR hour_of_call <= 4)
| number_of_late_night_false_alarms | |
|---|---|
| 0 | 2825 |
If we want to see about when there is a fire, we will need to either restrict our data to then or possible GROUP BY I think I’ll use the group by since I already did one with the WHERE.
%%bigquery --project pic-math
SELECT incident_group, AVG(num_pumps_attending) as avg_pumps_attending
FROM `bigquery-public-data.london_fire_brigade.fire_brigade_service_calls`
GROUP BY incident_group
| incident_group | avg_pumps_attending | |
|---|---|---|
| 0 | False Alarm | 1.725776 |
| 1 | Fire | 1.633012 |
| 2 | Special Service | 1.177192 |
HTML#
To navigate to the wikipedia page I’ll need some other packages!
import requests
import pandas as pa
from bs4 import BeautifulSoup


r = requests.get('https://en.wikipedia.org/wiki/Oklahoma')
html_contents = r.text
html_soup = BeautifulSoup(html_contents,"lxml")
tables = html_soup.find_all('table',class_="wikitable")

df = pa.read_html(str(tables))[0]


df = df.melt(id_vars = ['City','Unnamed: 1'],
                  value_vars = df.columns[2:],
                  var_name = 'month'
)

df.value = df.value.apply(lambda s: int(s[:2]))

df.columns = ['City','Low_High', 'Month','Temp_F']

df
| City | Low_High | Month | Temp_F | |
|---|---|---|---|---|
| 0 | Oklahoma City | Avg. high | Jan | 50 |
| 1 | Oklahoma City | Avg. low | Jan | 29 |
| 2 | Tulsa | Avg. high | Jan | 48 |
| 3 | Tulsa | Avg. low | Jan | 27 |
| 4 | Lawton | Avg. high | Jan | 50 |
| ... | ... | ... | ... | ... |
| 67 | Oklahoma City | Avg. low | Dec | 31 |
| 68 | Tulsa | Avg. high | Dec | 49 |
| 69 | Tulsa | Avg. low | Dec | 30 |
| 70 | Lawton | Avg. high | Dec | 52 |
| 71 | Lawton | Avg. low | Dec | 30 |
72 rows × 4 columns
df.describe()
| Temp_F | |
|---|---|
| count | 72.000000 |
| mean | 61.333333 |
| std | 19.325966 |
| min | 26.000000 |
| 25% | 49.000000 |
| 50% | 62.000000 |
| 75% | 73.000000 |
| max | 96.000000 |
df.query('City == "Oklahoma City" and Low_High == "Avg. high"').Temp_F.mean()
72.25
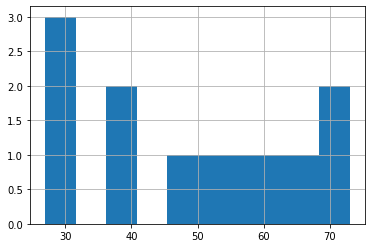
df.query('City == "Tulsa" and Low_High == "Avg. low"').Temp_F.hist()
<matplotlib.axes._subplots.AxesSubplot at 0x7f7e49a98050>
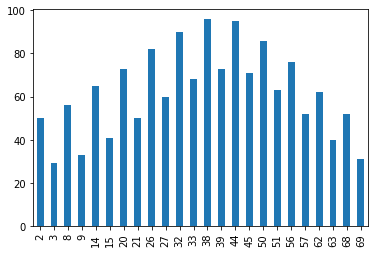
df.groupby('City')['Temp_F'].plot(kind ='bar')
City
Lawton           AxesSubplot(0.125,0.125;0.775x0.755)
Oklahoma City    AxesSubplot(0.125,0.125;0.775x0.755)
Tulsa            AxesSubplot(0.125,0.125;0.775x0.755)
Name: Temp_F, dtype: object
df.query('Low_High == "Avg. high"').groupby('Month').agg(['mean','max'])
| Temp_F | ||
|---|---|---|
| mean | max | |
| Month | ||
| April | 72.666667 | 73 |
| Aug | 93.666667 | 95 |
| Dec | 50.666667 | 52 |
| Feb | 54.666667 | 56 |
| Jan | 49.333333 | 50 |
| July | 94.333333 | 96 |
| June | 88.666667 | 90 |
| March | 63.333333 | 65 |
| May | 80.333333 | 82 |
| Nov | 61.666667 | 62 |
| Oct | 74.000000 | 76 |
| Sept | 85.000000 | 86 |
df[df.Temp_F == df.groupby('Month').Temp_F.transform(max)]
| City | Low_High | Month | Temp_F | |
|---|---|---|---|---|
| 0 | Oklahoma City | Avg. high | Jan | 50 |
| 4 | Lawton | Avg. high | Jan | 50 |
| 10 | Lawton | Avg. high | Feb | 56 |
| 16 | Lawton | Avg. high | March | 65 |
| 18 | Oklahoma City | Avg. high | April | 73 |
| 22 | Lawton | Avg. high | April | 73 |
| 28 | Lawton | Avg. high | May | 82 |
| 34 | Lawton | Avg. high | June | 90 |
| 40 | Lawton | Avg. high | July | 96 |
| 46 | Lawton | Avg. high | Aug | 95 |
| 52 | Lawton | Avg. high | Sept | 86 |
| 58 | Lawton | Avg. high | Oct | 76 |
| 60 | Oklahoma City | Avg. high | Nov | 62 |
| 64 | Lawton | Avg. high | Nov | 62 |
| 70 | Lawton | Avg. high | Dec | 52 |