![]()
Exam 3 Solutions Data Visualization and Preprocessing#
import numpy as np
import pandas as pa
import seaborn as sns
import matplotlib.pyplot as plt

df = pa.read_csv('https://raw.githubusercontent.com/nurfnick/Data_Viz/main/worldCupPlayer.csv')
df.head()
| Unnamed: 0 | Rank | player | club | age | Apps | Mins | Goals | Assists | Yel | Red | SpG | PS | AerialsWon | MotM | Rating | nationality | |
|---|---|---|---|---|---|---|---|---|---|---|---|---|---|---|---|---|---|
| 0 | 0 | 1 | Hakim Ziyech | Ajax | 25 | 34 | 3043 | 9 | 15 | 4 | 0 | 4.9 | 75.4 | 0.2 | 9 | 8.21 | Morocco |
| 1 | 2 | 2 | Alireza Jahanbakhsh | AZ Alkmaar | 24 | 33 | 2840 | 21 | 12 | 3 | 0 | 4.3 | 73.4 | 0.7 | 14 | 8.20 | Iran |
| 2 | 4 | 3 | Hirving Lozano | PSV Eindhoven | 22 | 29 | 2350 | 17 | 8 | 4 | 2 | 3.4 | 75.3 | 0.6 | 8 | 7.90 | Mexico |
| 3 | 6 | 11 | Lasse Schone | Ajax | 32 | 27(3) | 2350 | 10 | 3 | 6 | 0 | 1.9 | 87.0 | 1.9 | 2 | 7.45 | Denmark |
| 4 | 10 | 25 | Santiago Arias | PSV Eindhoven | 26 | 30 | 2664 | 3 | 6 | 5 | 0 | 1.5 | 82.3 | 1 | 2 | 7.25 | Colombia |
COYS!#

df.query('club == "Tottenham"')
| Unnamed: 0 | Rank | player | club | age | Apps | Mins | Goals | Assists | Yel | Red | SpG | PS | AerialsWon | MotM | Rating | nationality | |
|---|---|---|---|---|---|---|---|---|---|---|---|---|---|---|---|---|---|
| 414 | 795 | 5 | Harry Kane | Tottenham | 24 | 35(2) | 3083 | 30 | 2 | 5 | 0 | 5 | 71.2 | 1.6 | 9 | 7.60 | England |
| 415 | 796 | 2 | Harry Kane | Tottenham | 24 | 7 | 597 | 7 | 2 | 0 | 0 | 4.6 | 78.6 | 1.6 | 2 | 8.34 | England |
| 422 | 806 | 11 | Christian Eriksen | Tottenham | 26 | 37 | 3226 | 10 | 10 | 0 | 0 | 2.6 | 82.4 | 0.5 | 4 | 7.40 | Denmark |
| 423 | 808 | 95 | Christian Eriksen | Tottenham | 26 | 6 | 535 | 2 | 1 | 0 | 0 | 3.3 | 83.1 | 0.5 | 0 | 7.08 | Denmark |
| 430 | 820 | 22 | Jan Vertonghen | Tottenham | 31 | 36 | 3205 | 0 | 0 | 4 | 0 | 0.7 | 86.3 | 3.3 | 3 | 7.26 | Belgium |
| 431 | 822 | 231 | Jan Vertonghen | Tottenham | 31 | 6 | 540 | 0 | 1 | 1 | 1 | 0.3 | 86.5 | 2 | 0 | 6.75 | Belgium |
| 446 | 852 | 44 | Dele Alli | Tottenham | 22 | 34(2) | 2972 | 9 | 10 | 7 | 0 | 1.9 | 77.2 | 0.8 | 1 | 7.09 | England |
| 447 | 854 | 13 | Dele Alli | Tottenham | 22 | 5 | 427 | 2 | 4 | 1 | 0 | 1.6 | 80.7 | 0.6 | 1 | 7.73 | England |
| 455 | 870 | 57 | Kieran Trippier | Tottenham | 27 | 21(3) | 1914 | 0 | 5 | 1 | 0 | 0.3 | 81.4 | 1.5 | 0 | 7.04 | England |
| 464 | 888 | 75 | Eric Dier | Tottenham | 24 | 32(2) | 2827 | 0 | 2 | 4 | 0 | 0.9 | 86.3 | 2.4 | 0 | 6.96 | England |
| 465 | 890 | 179 | Eric Dier | Tottenham | 24 | 7 | 614 | 0 | 1 | 1 | 0 | 0.4 | 80.9 | 1.6 | 0 | 6.86 | England |
| 468 | 896 | 78 | Davinson Sanchez | Tottenham | 21 | 29(2) | 2535 | 0 | 0 | 1 | 1 | 0.3 | 89.4 | 2.4 | 0 | 6.94 | Colombia |
| 469 | 898 | 236 | Davinson Sanchez | Tottenham | 21 | 8 | 720 | 0 | 0 | 0 | 0 | 0.4 | 89.7 | 1.3 | 0 | 6.74 | Colombia |
| 475 | 910 | 94 | Mousa Dembele | Tottenham | 30 | 21(7) | 1886 | 0 | 0 | 6 | 0 | 0.4 | 92.2 | 0.3 | 0 | 6.90 | Belgium |
| 476 | 912 | 268 | Mousa Dembele | Tottenham | 30 | 3(3) | 328 | 0 | 0 | 2 | 0 | - | 92.7 | 0.2 | 0 | 6.66 | Belgium |
| 495 | 950 | 171 | Hugo Lloris | Tottenham | 31 | 36 | 3240 | 0 | 0 | 1 | 0 | - | 75.2 | 0.3 | 1 | 6.74 | France |
| 496 | 952 | 100 | Hugo Lloris | Tottenham | 31 | 7 | 630 | 0 | 0 | 0 | 0 | - | 60.2 | 0.4 | 0 | 7.07 | France |
| 558 | 1072 | 134 | Toby Alderweireld | Tottenham | 29 | 4 | 294 | 0 | 1 | 0 | 0 | 0.5 | 81.3 | 1.3 | 0 | 7.00 | Belgium |
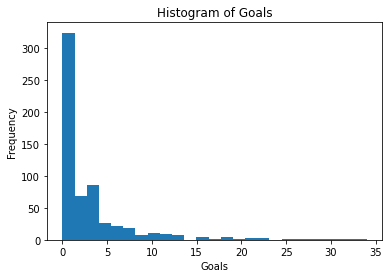
ax = df.Goals.plot.hist(title = 'Histogram of Goals', bins = 25)
ax.set(xlabel = 'Goals')
plt.show()
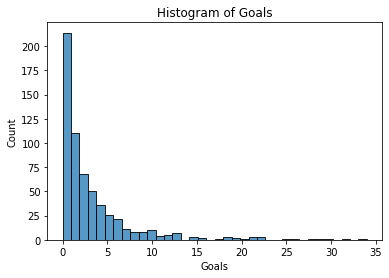
ax = sns.histplot(data = df, x = 'Goals')
ax.set(title = 'Histogram of Goals')
[Text(0.5, 1.0, 'Histogram of Goals')]
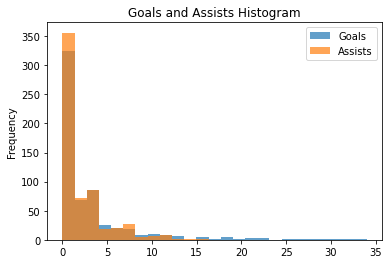
ax = df[['Goals','Assists']].plot.hist(alpha = .7, bins = 25)
ax.set(title = 'Goals and Assists Histogram')
plt.show()
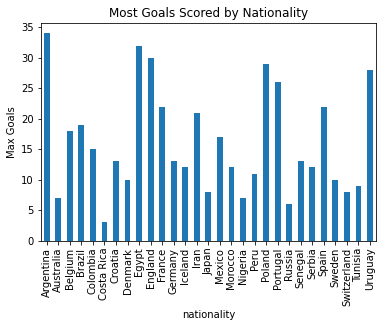
ax = df.groupby('nationality').Goals.agg('max').reset_index().plot(kind = 'bar', x = 'nationality', legend = False)
ax.set(title = 'Most Goals Scored by Nationality')
ax.set(ylabel = 'Max Goals')
plt.show()
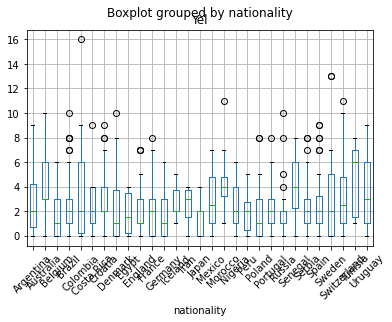
df.boxplot(by = 'nationality', column = 'Yel', rot = 45)
/usr/local/lib/python3.7/dist-packages/matplotlib/cbook/__init__.py:1376: VisibleDeprecationWarning: Creating an ndarray from ragged nested sequences (which is a list-or-tuple of lists-or-tuples-or ndarrays with different lengths or shapes) is deprecated. If you meant to do this, you must specify 'dtype=object' when creating the ndarray.
  X = np.atleast_1d(X.T if isinstance(X, np.ndarray) else np.asarray(X))
<matplotlib.axes._subplots.AxesSubplot at 0x7ff1c9c30090>
df.club == 'Tottenham'
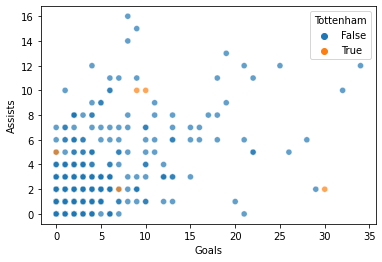
df['Tottenham'] = df.club == 'Tottenham'
sns.scatterplot(data = df, x = 'Goals', y = 'Assists', hue = 'Tottenham', alpha = .7)
<matplotlib.axes._subplots.AxesSubplot at 0x7ff1c9584610>
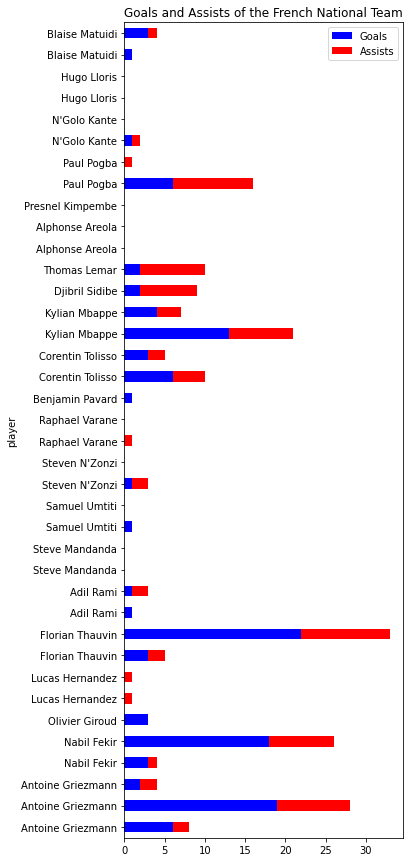
plt.rcParams["figure.figsize"] = (5,15)
ax = df[df.nationality == 'France'].plot.barh(x = 'player', y = ['Goals','Assists'], stacked = True, color = ['blue','red'])
ax.set(title = 'Goals and Assists of the French National Team')
plt.show()
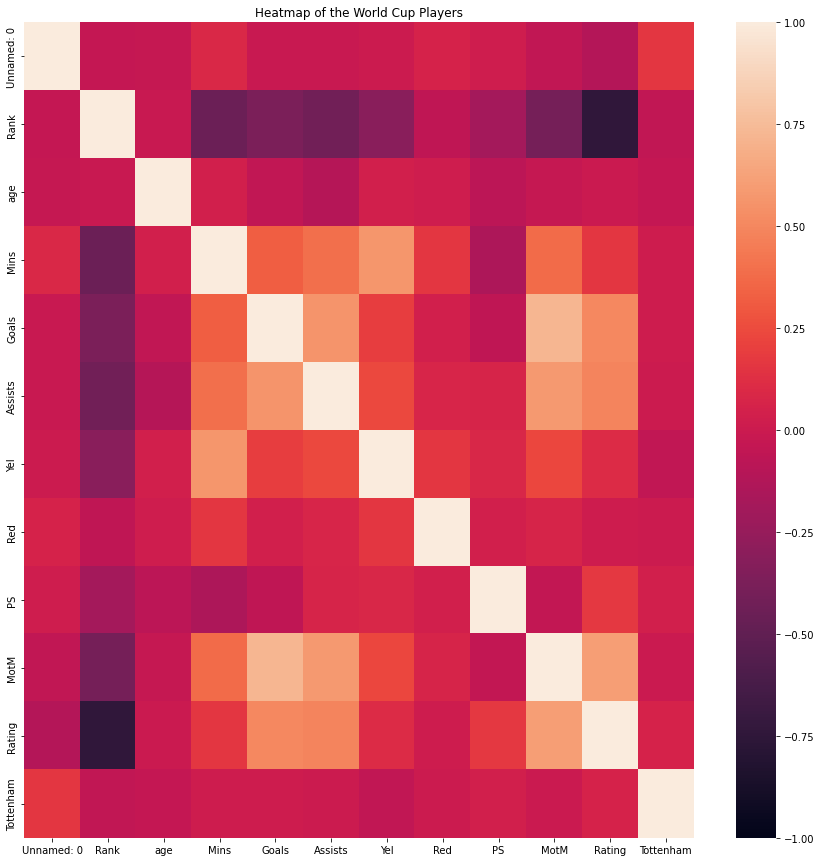
plt.rcParams["figure.figsize"] = (15,15)
ax = sns.heatmap(df.corr(),vmin = -1)
ax.set(title = 'Heatmap of the World Cup Players')
plt.show()