Regression Assignment
I want you to practice some regression and analyzing your results. Utilize this document to load data directly.
import pandas as pa
import numpy as np
import matplotlib.pyplot as plt
Linear Regression
Fit goals vs points in a linear regression. Fit a multiple regression on goals and assists vs points. What do you notice about these two fits. https://raw.githubusercontent.com/nurfnick/Data_Sets_For_Stats/master/CuratedDataSets/hockey.csv
df = pa.read_csv('https://raw.githubusercontent.com/nurfnick/Data_Sets_For_Stats/master/CuratedDataSets/hockey.csv')
x = np.array(df[['G','A']])
y = np.array(df.PTS)
Logistic Regression
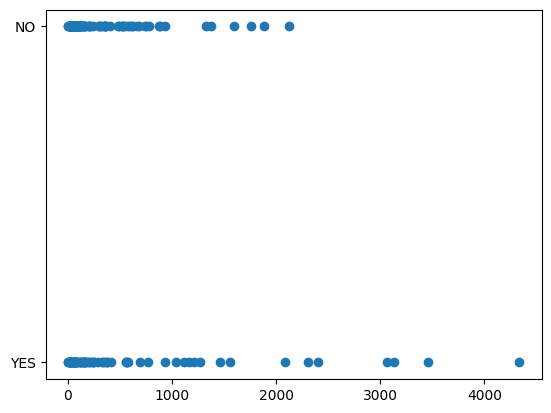
Using the 538 Avengers dataset,https://github.com/fivethirtyeight/data/blob/master/avengers/avengers.csv, fit a logistic regression to predict Death1 (first time a character might die) based on whatever variables you find interesting. Make a prediction using probabilities on your favorite character.
df = pa.read_csv('https://raw.githubusercontent.com/nurfnick/Data_Sets_For_Stats/master/CuratedDataSets/Avengers')
df.head()
| URL | Name/Alias | Appearances | Current? | Gender | Probationary Introl | Full/Reserve Avengers Intro | Year | Years since joining | Honorary | ... | Return1 | Death2 | Return2 | Death3 | Return3 | Death4 | Return4 | Death5 | Return5 | Notes | |
|---|---|---|---|---|---|---|---|---|---|---|---|---|---|---|---|---|---|---|---|---|---|
| 0 | http://marvel.wikia.com/Henry_Pym_(Earth-616) | Henry Jonathan "Hank" Pym | 1269 | YES | MALE | NaN | Sep-63 | 1963 | 52 | Full | ... | NO | NaN | NaN | NaN | NaN | NaN | NaN | NaN | NaN | Merged with Ultron in Rage of Ultron Vol. 1. A... |
| 1 | http://marvel.wikia.com/Janet_van_Dyne_(Earth-... | Janet van Dyne | 1165 | YES | FEMALE | NaN | Sep-63 | 1963 | 52 | Full | ... | YES | NaN | NaN | NaN | NaN | NaN | NaN | NaN | NaN | Dies in Secret Invasion V1:I8. Actually was se... |
| 2 | http://marvel.wikia.com/Anthony_Stark_(Earth-616) | Anthony Edward "Tony" Stark | 3068 | YES | MALE | NaN | Sep-63 | 1963 | 52 | Full | ... | YES | NaN | NaN | NaN | NaN | NaN | NaN | NaN | NaN | Death: "Later while under the influence of Imm... |
| 3 | http://marvel.wikia.com/Robert_Bruce_Banner_(E... | Robert Bruce Banner | 2089 | YES | MALE | NaN | Sep-63 | 1963 | 52 | Full | ... | YES | NaN | NaN | NaN | NaN | NaN | NaN | NaN | NaN | Dies in Ghosts of the Future arc. However "he ... |
| 4 | http://marvel.wikia.com/Thor_Odinson_(Earth-616) | Thor Odinson | 2402 | YES | MALE | NaN | Sep-63 | 1963 | 52 | Full | ... | YES | YES | NO | NaN | NaN | NaN | NaN | NaN | NaN | Dies in Fear Itself brought back because that'... |
5 rows × 21 columns
plt.scatter(df['Appearances'],df['Death1'])
<matplotlib.collections.PathCollection at 0x7f9f76320ee0>

Find Your Own Regression
I have compiled olympic 100m dash records from a wikipedia page https://en.wikipedia.org/wiki/100_metres_at_the_Olympics. Use this data and fit a regression of some type for prediciting Time. Justify your model used in words and pictures. Predict the new Olympic Record for 2024 and 2300. Describe in words the validity of your predictions.
df = pa.read_csv('https://raw.githubusercontent.com/nurfnick/Data_Sets_For_Stats/master/CuratedDataSets/100mOlympicRecords.csv')
x = np.array(df)

df.head()
| Time | Athlete | Nation | Games | Round | Date | Gender | |
|---|---|---|---|---|---|---|---|
| 0 | 12.2 | Francis Lane | United States (USA) | 1896 | Heat 1 | 1896-04-06 | Men |
| 1 | 12.2 | Thomas Curtis | United States (USA) | 1896 | Heat 2 | 1896-04-06 | Men |
| 2 | 11.8 | Tom Burke | United States (USA) | 1896 | Heat 3 | 1896-04-06 | Men |
| 3 | 11.4 | Arthur Duffey | United States (USA) | 1900 | Heat 1 | 6/14/1900 | Men |
| 4 | 11.4 | Walter Tewksbury | United States (USA) | 1900 | Heat 2 | 6/14/1900 | Men |
